Synechococcus phage S-WAM1
Taxonomy: Viruses; Duplodnaviria; Heunggongvirae; Uroviricota; Caudoviricetes; Caudovirales; Myoviridae; Libanvirus; unclassified Libanvirus
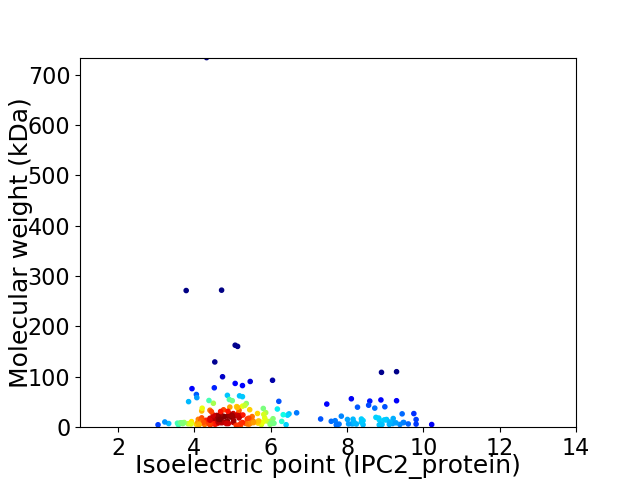
Average proteome isoelectric point is 5.79
Get precalculated fractions of proteins

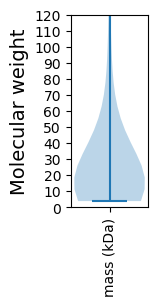
Virtual 2D-PAGE plot for 221 proteins (isoelectric point calculated using IPC2_protein)
Get csv file with sequences according to given criteria:
* You can choose from 21 different methods for calculating isoelectric point
Summary statistics related to proteome-wise predictions


Protein with the lowest isoelectric point:
>tr|A0A1D8KSQ4|A0A1D8KSQ4_9CAUD Peptidase OS=Synechococcus phage S-WAM1 OX=1815521 GN=P090810_134 PE=4 SV=1
MM1 pKa = 7.82ADD3 pKa = 3.4ASFLYY8 pKa = 10.16IAFFLTIGSFVLGFISSWNLKK29 pKa = 9.75HH30 pKa = 7.03VFDD33 pKa = 4.11VWVDD37 pKa = 3.2RR38 pKa = 11.84ADD40 pKa = 3.52YY41 pKa = 10.81ARR43 pKa = 11.84VVMHH47 pKa = 6.84PEE49 pKa = 3.94MYY51 pKa = 10.6DD52 pKa = 3.45EE53 pKa = 6.46DD54 pKa = 5.67GMLTDD59 pKa = 3.82QPLIYY64 pKa = 10.46LHH66 pKa = 7.77IEE68 pKa = 4.43DD69 pKa = 5.23EE70 pKa = 4.54DD71 pKa = 4.81DD72 pKa = 3.42MMYY75 pKa = 11.07DD76 pKa = 3.76EE77 pKa = 6.61DD78 pKa = 4.97DD79 pKa = 3.44
MM1 pKa = 7.82ADD3 pKa = 3.4ASFLYY8 pKa = 10.16IAFFLTIGSFVLGFISSWNLKK29 pKa = 9.75HH30 pKa = 7.03VFDD33 pKa = 4.11VWVDD37 pKa = 3.2RR38 pKa = 11.84ADD40 pKa = 3.52YY41 pKa = 10.81ARR43 pKa = 11.84VVMHH47 pKa = 6.84PEE49 pKa = 3.94MYY51 pKa = 10.6DD52 pKa = 3.45EE53 pKa = 6.46DD54 pKa = 5.67GMLTDD59 pKa = 3.82QPLIYY64 pKa = 10.46LHH66 pKa = 7.77IEE68 pKa = 4.43DD69 pKa = 5.23EE70 pKa = 4.54DD71 pKa = 4.81DD72 pKa = 3.42MMYY75 pKa = 11.07DD76 pKa = 3.76EE77 pKa = 6.61DD78 pKa = 4.97DD79 pKa = 3.44
Molecular weight: 9.34 kDa
Isoelectric point according different methods:
Protein with the highest isoelectric point:
>tr|A0A1D8KS44|A0A1D8KS44_9CAUD Uncharacterized protein OS=Synechococcus phage S-WAM1 OX=1815521 GN=P090810_030 PE=4 SV=1
MM1 pKa = 7.06NTPNWQHH8 pKa = 6.03HH9 pKa = 5.47SKK11 pKa = 10.91KK12 pKa = 9.31EE13 pKa = 3.94AKK15 pKa = 8.62RR16 pKa = 11.84TLKK19 pKa = 10.42PQALRR24 pKa = 11.84QAKK27 pKa = 9.23KK28 pKa = 10.21RR29 pKa = 11.84RR30 pKa = 11.84AALKK34 pKa = 10.43AKK36 pKa = 10.12LLAASVVLVGAASPAQAVTWGEE58 pKa = 3.56FWEE61 pKa = 4.78PFTGDD66 pKa = 2.98RR67 pKa = 11.84HH68 pKa = 5.17HH69 pKa = 6.77HH70 pKa = 5.3HH71 pKa = 6.72VEE73 pKa = 3.18RR74 pKa = 11.84HH75 pKa = 5.25YY76 pKa = 10.5YY77 pKa = 9.68HH78 pKa = 7.57PAPPPPRR85 pKa = 11.84MCRR88 pKa = 11.84RR89 pKa = 11.84KK90 pKa = 9.81QVVDD94 pKa = 2.91TWVEE98 pKa = 3.78PTPFYY103 pKa = 10.34PGYY106 pKa = 7.78WSQRR110 pKa = 11.84IRR112 pKa = 11.84WTWEE116 pKa = 3.13PCHH119 pKa = 6.13RR120 pKa = 11.84HH121 pKa = 3.95RR122 pKa = 11.84HH123 pKa = 5.59RR124 pKa = 11.84YY125 pKa = 8.66DD126 pKa = 2.93HH127 pKa = 7.04
MM1 pKa = 7.06NTPNWQHH8 pKa = 6.03HH9 pKa = 5.47SKK11 pKa = 10.91KK12 pKa = 9.31EE13 pKa = 3.94AKK15 pKa = 8.62RR16 pKa = 11.84TLKK19 pKa = 10.42PQALRR24 pKa = 11.84QAKK27 pKa = 9.23KK28 pKa = 10.21RR29 pKa = 11.84RR30 pKa = 11.84AALKK34 pKa = 10.43AKK36 pKa = 10.12LLAASVVLVGAASPAQAVTWGEE58 pKa = 3.56FWEE61 pKa = 4.78PFTGDD66 pKa = 2.98RR67 pKa = 11.84HH68 pKa = 5.17HH69 pKa = 6.77HH70 pKa = 5.3HH71 pKa = 6.72VEE73 pKa = 3.18RR74 pKa = 11.84HH75 pKa = 5.25YY76 pKa = 10.5YY77 pKa = 9.68HH78 pKa = 7.57PAPPPPRR85 pKa = 11.84MCRR88 pKa = 11.84RR89 pKa = 11.84KK90 pKa = 9.81QVVDD94 pKa = 2.91TWVEE98 pKa = 3.78PTPFYY103 pKa = 10.34PGYY106 pKa = 7.78WSQRR110 pKa = 11.84IRR112 pKa = 11.84WTWEE116 pKa = 3.13PCHH119 pKa = 6.13RR120 pKa = 11.84HH121 pKa = 3.95RR122 pKa = 11.84HH123 pKa = 5.59RR124 pKa = 11.84YY125 pKa = 8.66DD126 pKa = 2.93HH127 pKa = 7.04
Molecular weight: 15.21 kDa
Isoelectric point according different methods:
Peptides (in silico digests for buttom-up proteomics)
Below you can find in silico digests of the whole proteome with Trypsin, Chymotrypsin, Trypsin+LysC, LysN, ArgC proteases suitable for different mass spec machines.| Try ESI |
 |
|---|
| ChTry ESI |
 |
|---|
| ArgC ESI |
 |
|---|
| LysN ESI |
 |
|---|
| TryLysC ESI |
 |
|---|
| Try MALDI |
 |
|---|
| ChTry MALDI |
 |
|---|
| ArgC MALDI |
 |
|---|
| LysN MALDI |
 |
|---|
| TryLysC MALDI |
 |
|---|
| Try LTQ |
 |
|---|
| ChTry LTQ |
 |
|---|
| ArgC LTQ |
 |
|---|
| LysN LTQ |
 |
|---|
| TryLysC LTQ |
 |
|---|
| Try MSlow |
 |
|---|
| ChTry MSlow |
 |
|---|
| ArgC MSlow |
 |
|---|
| LysN MSlow |
 |
|---|
| TryLysC MSlow |
 |
|---|
| Try MShigh |
 |
|---|
| ChTry MShigh |
 |
|---|
| ArgC MShigh |
 |
|---|
| LysN MShigh |
 |
|---|
| TryLysC MShigh |
 |
|---|
General Statistics
Number of major isoforms |
Number of additional isoforms |
Number of all proteins |
Number of amino acids |
Min. Seq. Length |
Max. Seq. Length |
Avg. Seq. Length |
Avg. Mol. Weight |
|---|---|---|---|---|---|---|---|
0 |
57904 |
35 |
6737 |
262.0 |
29.14 |
Amino acid frequency
Ala |
Cys |
Asp |
Glu |
Phe |
Gly |
His |
Ile |
Lys |
Leu |
|---|---|---|---|---|---|---|---|---|---|
7.088 ± 0.206 | 0.92 ± 0.093 |
6.92 ± 0.173 | 6.131 ± 0.263 |
4.302 ± 0.111 | 7.939 ± 0.35 |
1.743 ± 0.149 | 6.155 ± 0.28 |
5.468 ± 0.407 | 7.103 ± 0.214 |
Met |
Asn |
Gln |
Pro |
Arg |
Ser |
Thr |
Val |
Trp |
Tyr |
|---|---|---|---|---|---|---|---|---|---|
2.083 ± 0.187 | 5.915 ± 0.224 |
4.076 ± 0.137 | 3.791 ± 0.088 |
4.312 ± 0.165 | 6.702 ± 0.159 |
7.265 ± 0.409 | 6.588 ± 0.163 |
1.314 ± 0.095 | 4.185 ± 0.151 |
Most of the basic statistics you can see at this page can be downloaded from this CSV file
Proteome-pI is available under Creative Commons Attribution-NoDerivs license, for more details see here
| Reference: Kozlowski LP. Proteome-pI 2.0: Proteome Isoelectric Point Database Update. Nucleic Acids Res. 2021, doi: 10.1093/nar/gkab944 | Contact: Lukasz P. Kozlowski |
