Rhodoferax sediminis
Taxonomy: cellular organisms; Bacteria; Proteobacteria; Betaproteobacteria; Burkholderiales; Comamonadaceae; Rhodoferax
Average proteome isoelectric point is 6.85
Get precalculated fractions of proteins

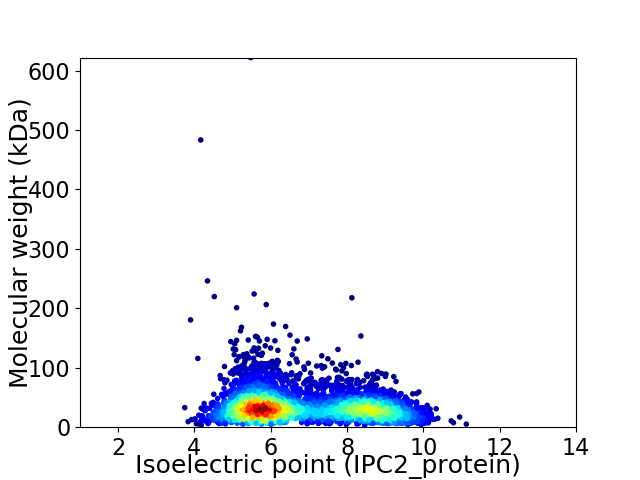
Virtual 2D-PAGE plot for 4235 proteins (isoelectric point calculated using IPC2_protein)
Get csv file with sequences according to given criteria:
* You can choose from 21 different methods for calculating isoelectric point
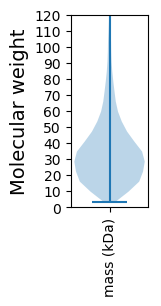
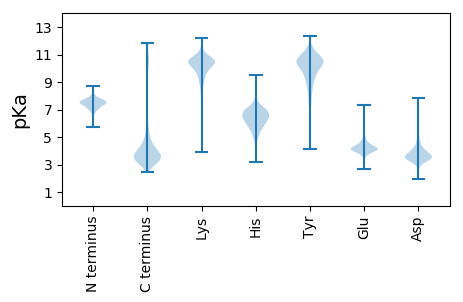
Summary statistics related to proteome-wise predictions


Protein with the lowest isoelectric point:
>tr|A0A515ET31|A0A515ET31_9BURK Histidine kinase OS=Rhodoferax sediminis OX=2509614 GN=EXZ61_17540 PE=4 SV=1
MM1 pKa = 7.13QANPPPNLDD10 pKa = 5.59DD11 pKa = 4.77EE12 pKa = 5.25DD13 pKa = 6.88ADD15 pKa = 4.96DD16 pKa = 5.66GPSACIMVFNANDD29 pKa = 3.33ASGAGGISADD39 pKa = 3.55LTAIASVGAHH49 pKa = 7.06ALPVITGAYY58 pKa = 10.07ARR60 pKa = 11.84DD61 pKa = 3.29TSEE64 pKa = 5.19ILDD67 pKa = 4.27HH68 pKa = 7.07YY69 pKa = 10.46PFDD72 pKa = 5.11DD73 pKa = 4.11EE74 pKa = 5.92AVTEE78 pKa = 4.02QARR81 pKa = 11.84AILEE85 pKa = 4.75DD86 pKa = 3.43IPVDD90 pKa = 3.59VFKK93 pKa = 11.33VGFVGSPEE101 pKa = 4.0NLSAIAEE108 pKa = 4.32LASDD112 pKa = 4.19YY113 pKa = 11.8ADD115 pKa = 4.33LPLVAYY121 pKa = 9.51MPDD124 pKa = 3.73LSWWQEE130 pKa = 3.84DD131 pKa = 4.12LTDD134 pKa = 3.99QYY136 pKa = 11.85HH137 pKa = 6.65DD138 pKa = 3.66ACTEE142 pKa = 3.91LLLPQTTVLVGNYY155 pKa = 7.45STLTRR160 pKa = 11.84WLLPDD165 pKa = 3.87WSTPLPPSALDD176 pKa = 3.46LARR179 pKa = 11.84AANEE183 pKa = 3.76YY184 pKa = 9.5GVPYY188 pKa = 9.96TLVTGMPLPDD198 pKa = 3.24QHH200 pKa = 7.88IDD202 pKa = 3.49NVLCTPEE209 pKa = 5.22AVLCSHH215 pKa = 6.99KK216 pKa = 10.56YY217 pKa = 9.7EE218 pKa = 4.08RR219 pKa = 11.84FEE221 pKa = 4.67AVFSGAGDD229 pKa = 3.75TLSAALAALIASDD242 pKa = 4.09TEE244 pKa = 4.03LVEE247 pKa = 4.47AVGEE251 pKa = 4.0ALSYY255 pKa = 11.16LDD257 pKa = 3.7RR258 pKa = 11.84CLEE261 pKa = 3.95NGFRR265 pKa = 11.84PGMGNVLPDD274 pKa = 3.6RR275 pKa = 11.84LFWAHH280 pKa = 6.8PEE282 pKa = 3.86EE283 pKa = 6.34DD284 pKa = 3.87EE285 pKa = 4.79TDD287 pKa = 3.58DD288 pKa = 5.32ATDD291 pKa = 3.81LDD293 pKa = 4.89SNFEE297 pKa = 3.89ISPNATRR304 pKa = 11.84HH305 pKa = 4.44
MM1 pKa = 7.13QANPPPNLDD10 pKa = 5.59DD11 pKa = 4.77EE12 pKa = 5.25DD13 pKa = 6.88ADD15 pKa = 4.96DD16 pKa = 5.66GPSACIMVFNANDD29 pKa = 3.33ASGAGGISADD39 pKa = 3.55LTAIASVGAHH49 pKa = 7.06ALPVITGAYY58 pKa = 10.07ARR60 pKa = 11.84DD61 pKa = 3.29TSEE64 pKa = 5.19ILDD67 pKa = 4.27HH68 pKa = 7.07YY69 pKa = 10.46PFDD72 pKa = 5.11DD73 pKa = 4.11EE74 pKa = 5.92AVTEE78 pKa = 4.02QARR81 pKa = 11.84AILEE85 pKa = 4.75DD86 pKa = 3.43IPVDD90 pKa = 3.59VFKK93 pKa = 11.33VGFVGSPEE101 pKa = 4.0NLSAIAEE108 pKa = 4.32LASDD112 pKa = 4.19YY113 pKa = 11.8ADD115 pKa = 4.33LPLVAYY121 pKa = 9.51MPDD124 pKa = 3.73LSWWQEE130 pKa = 3.84DD131 pKa = 4.12LTDD134 pKa = 3.99QYY136 pKa = 11.85HH137 pKa = 6.65DD138 pKa = 3.66ACTEE142 pKa = 3.91LLLPQTTVLVGNYY155 pKa = 7.45STLTRR160 pKa = 11.84WLLPDD165 pKa = 3.87WSTPLPPSALDD176 pKa = 3.46LARR179 pKa = 11.84AANEE183 pKa = 3.76YY184 pKa = 9.5GVPYY188 pKa = 9.96TLVTGMPLPDD198 pKa = 3.24QHH200 pKa = 7.88IDD202 pKa = 3.49NVLCTPEE209 pKa = 5.22AVLCSHH215 pKa = 6.99KK216 pKa = 10.56YY217 pKa = 9.7EE218 pKa = 4.08RR219 pKa = 11.84FEE221 pKa = 4.67AVFSGAGDD229 pKa = 3.75TLSAALAALIASDD242 pKa = 4.09TEE244 pKa = 4.03LVEE247 pKa = 4.47AVGEE251 pKa = 4.0ALSYY255 pKa = 11.16LDD257 pKa = 3.7RR258 pKa = 11.84CLEE261 pKa = 3.95NGFRR265 pKa = 11.84PGMGNVLPDD274 pKa = 3.6RR275 pKa = 11.84LFWAHH280 pKa = 6.8PEE282 pKa = 3.86EE283 pKa = 6.34DD284 pKa = 3.87EE285 pKa = 4.79TDD287 pKa = 3.58DD288 pKa = 5.32ATDD291 pKa = 3.81LDD293 pKa = 4.89SNFEE297 pKa = 3.89ISPNATRR304 pKa = 11.84HH305 pKa = 4.44
Molecular weight: 32.87 kDa
Isoelectric point according different methods:
Protein with the highest isoelectric point:
>tr|A0A515EVA7|A0A515EVA7_9BURK Uncharacterized protein OS=Rhodoferax sediminis OX=2509614 GN=EXZ61_01280 PE=4 SV=1
MM1 pKa = 7.35KK2 pKa = 9.43RR3 pKa = 11.84TYY5 pKa = 10.07QPSKK9 pKa = 9.07IRR11 pKa = 11.84RR12 pKa = 11.84ARR14 pKa = 11.84THH16 pKa = 5.91GFLVRR21 pKa = 11.84MKK23 pKa = 9.7TRR25 pKa = 11.84GGRR28 pKa = 11.84AVINARR34 pKa = 11.84RR35 pKa = 11.84AKK37 pKa = 9.58GRR39 pKa = 11.84KK40 pKa = 8.75RR41 pKa = 11.84LAVV44 pKa = 3.41
MM1 pKa = 7.35KK2 pKa = 9.43RR3 pKa = 11.84TYY5 pKa = 10.07QPSKK9 pKa = 9.07IRR11 pKa = 11.84RR12 pKa = 11.84ARR14 pKa = 11.84THH16 pKa = 5.91GFLVRR21 pKa = 11.84MKK23 pKa = 9.7TRR25 pKa = 11.84GGRR28 pKa = 11.84AVINARR34 pKa = 11.84RR35 pKa = 11.84AKK37 pKa = 9.58GRR39 pKa = 11.84KK40 pKa = 8.75RR41 pKa = 11.84LAVV44 pKa = 3.41
Molecular weight: 5.15 kDa
Isoelectric point according different methods:
Peptides (in silico digests for buttom-up proteomics)
Below you can find in silico digests of the whole proteome with Trypsin, Chymotrypsin, Trypsin+LysC, LysN, ArgC proteases suitable for different mass spec machines.| Try ESI |
 |
|---|
| ChTry ESI |
 |
|---|
| ArgC ESI |
 |
|---|
| LysN ESI |
 |
|---|
| TryLysC ESI |
 |
|---|
| Try MALDI |
 |
|---|
| ChTry MALDI |
 |
|---|
| ArgC MALDI |
 |
|---|
| LysN MALDI |
 |
|---|
| TryLysC MALDI |
 |
|---|
| Try LTQ |
 |
|---|
| ChTry LTQ |
 |
|---|
| ArgC LTQ |
 |
|---|
| LysN LTQ |
 |
|---|
| TryLysC LTQ |
 |
|---|
| Try MSlow |
 |
|---|
| ChTry MSlow |
 |
|---|
| ArgC MSlow |
 |
|---|
| LysN MSlow |
 |
|---|
| TryLysC MSlow |
 |
|---|
| Try MShigh |
 |
|---|
| ChTry MShigh |
 |
|---|
| ArgC MShigh |
 |
|---|
| LysN MShigh |
 |
|---|
| TryLysC MShigh |
 |
|---|
General Statistics
Number of major isoforms |
Number of additional isoforms |
Number of all proteins |
Number of amino acids |
Min. Seq. Length |
Max. Seq. Length |
Avg. Seq. Length |
Avg. Mol. Weight |
|---|---|---|---|---|---|---|---|
0 |
1418997 |
32 |
6154 |
335.1 |
36.4 |
Amino acid frequency
Ala |
Cys |
Asp |
Glu |
Phe |
Gly |
His |
Ile |
Lys |
Leu |
|---|---|---|---|---|---|---|---|---|---|
12.323 ± 0.049 | 0.967 ± 0.011 |
5.075 ± 0.03 | 4.996 ± 0.035 |
3.561 ± 0.026 | 7.803 ± 0.033 |
2.372 ± 0.023 | 4.401 ± 0.025 |
3.942 ± 0.04 | 10.695 ± 0.048 |
Met |
Asn |
Gln |
Pro |
Arg |
Ser |
Thr |
Val |
Trp |
Tyr |
|---|---|---|---|---|---|---|---|---|---|
2.633 ± 0.022 | 2.974 ± 0.025 |
4.836 ± 0.033 | 4.526 ± 0.035 |
5.786 ± 0.034 | 5.957 ± 0.029 |
5.563 ± 0.048 | 7.778 ± 0.029 |
1.491 ± 0.018 | 2.321 ± 0.018 |
Most of the basic statistics you can see at this page can be downloaded from this CSV file
Proteome-pI is available under Creative Commons Attribution-NoDerivs license, for more details see here
| Reference: Kozlowski LP. Proteome-pI 2.0: Proteome Isoelectric Point Database Update. Nucleic Acids Res. 2021, doi: 10.1093/nar/gkab944 | Contact: Lukasz P. Kozlowski |
