Phanerochaete carnosa (strain HHB-10118-sp) (White-rot fungus) (Peniophora carnosa)
Taxonomy: cellular organisms; Eukaryota; Opisthokonta; Fungi; Dikarya; Basidiomycota; Agaricomycotina; Agaricomycetes; Agaricomycetes incertae sedis; Polyporales; Phanerochaetaceae; Phanerochaete; Phanerochaete carnosa
Average proteome isoelectric point is 6.55
Get precalculated fractions of proteins

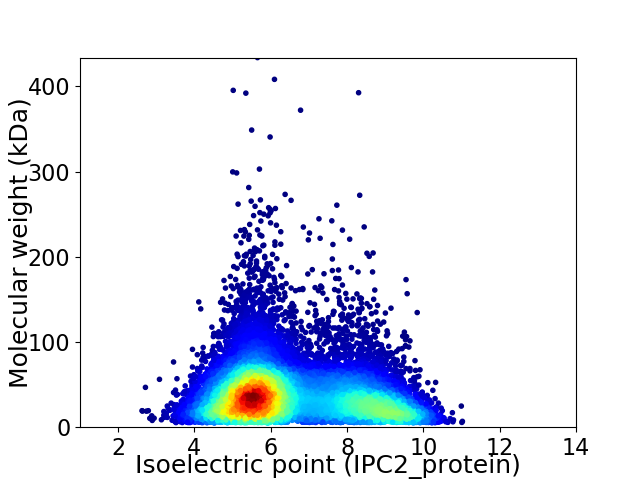
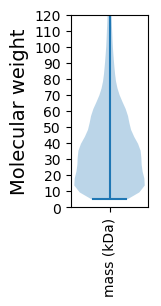
Virtual 2D-PAGE plot for 13867 proteins (isoelectric point calculated using IPC2_protein)
Get csv file with sequences according to given criteria:
* You can choose from 21 different methods for calculating isoelectric point
Summary statistics related to proteome-wise predictions


Protein with the lowest isoelectric point:
>tr|K5W9S3|K5W9S3_PHACS Glycoside hydrolase family 16 protein OS=Phanerochaete carnosa (strain HHB-10118-sp) OX=650164 GN=PHACADRAFT_246779 PE=4 SV=1
MM1 pKa = 7.47PAIRR5 pKa = 11.84LLSTTLFAAGTLAASLPSLASLQASSGICGSVGEE39 pKa = 4.14VSLNKK44 pKa = 9.92IEE46 pKa = 4.18VWSGATKK53 pKa = 10.61LGFLAPDD60 pKa = 3.36VSGLLGGGYY69 pKa = 10.5GIISPDD75 pKa = 3.21TSDD78 pKa = 3.66ALTGVFTCGAPTNPVTMGAANAQTVPGTNVNAIGLIAPYY117 pKa = 9.42YY118 pKa = 9.0PNGGSPDD125 pKa = 3.7LASGGSNWLALGATYY140 pKa = 10.59VSPSGAKK147 pKa = 9.89PNATGITFGDD157 pKa = 3.58SQAWFEE163 pKa = 4.45SSVWTTSGGYY173 pKa = 9.86DD174 pKa = 3.65GNGNYY179 pKa = 9.58HH180 pKa = 7.58DD181 pKa = 5.18YY182 pKa = 10.62ILHH185 pKa = 6.17EE186 pKa = 4.76SEE188 pKa = 4.53SHH190 pKa = 4.92WVNSDD195 pKa = 2.68GDD197 pKa = 4.26LPSLLLAALPDD208 pKa = 3.3QGGIVVTGDD217 pKa = 3.26FNAFADD223 pKa = 3.9SYY225 pKa = 10.89SYY227 pKa = 10.57VGNWVEE233 pKa = 4.17VQLASAPASDD243 pKa = 4.44RR244 pKa = 11.84GGPPPQATLVAAVAIINPLGAVDD267 pKa = 5.78SDD269 pKa = 5.46DD270 pKa = 6.09SDD272 pKa = 6.11DD273 pKa = 6.07DD274 pKa = 5.25DD275 pKa = 4.44DD276 pKa = 7.04ASVNEE281 pKa = 4.27HH282 pKa = 6.1RR283 pKa = 11.84QGSLDD288 pKa = 3.71AADD291 pKa = 3.78SDD293 pKa = 3.92VGVRR297 pKa = 11.84DD298 pKa = 3.54RR299 pKa = 11.84EE300 pKa = 4.21RR301 pKa = 11.84RR302 pKa = 11.84CAAAVVHH309 pKa = 6.6LVLL312 pKa = 5.72
MM1 pKa = 7.47PAIRR5 pKa = 11.84LLSTTLFAAGTLAASLPSLASLQASSGICGSVGEE39 pKa = 4.14VSLNKK44 pKa = 9.92IEE46 pKa = 4.18VWSGATKK53 pKa = 10.61LGFLAPDD60 pKa = 3.36VSGLLGGGYY69 pKa = 10.5GIISPDD75 pKa = 3.21TSDD78 pKa = 3.66ALTGVFTCGAPTNPVTMGAANAQTVPGTNVNAIGLIAPYY117 pKa = 9.42YY118 pKa = 9.0PNGGSPDD125 pKa = 3.7LASGGSNWLALGATYY140 pKa = 10.59VSPSGAKK147 pKa = 9.89PNATGITFGDD157 pKa = 3.58SQAWFEE163 pKa = 4.45SSVWTTSGGYY173 pKa = 9.86DD174 pKa = 3.65GNGNYY179 pKa = 9.58HH180 pKa = 7.58DD181 pKa = 5.18YY182 pKa = 10.62ILHH185 pKa = 6.17EE186 pKa = 4.76SEE188 pKa = 4.53SHH190 pKa = 4.92WVNSDD195 pKa = 2.68GDD197 pKa = 4.26LPSLLLAALPDD208 pKa = 3.3QGGIVVTGDD217 pKa = 3.26FNAFADD223 pKa = 3.9SYY225 pKa = 10.89SYY227 pKa = 10.57VGNWVEE233 pKa = 4.17VQLASAPASDD243 pKa = 4.44RR244 pKa = 11.84GGPPPQATLVAAVAIINPLGAVDD267 pKa = 5.78SDD269 pKa = 5.46DD270 pKa = 6.09SDD272 pKa = 6.11DD273 pKa = 6.07DD274 pKa = 5.25DD275 pKa = 4.44DD276 pKa = 7.04ASVNEE281 pKa = 4.27HH282 pKa = 6.1RR283 pKa = 11.84QGSLDD288 pKa = 3.71AADD291 pKa = 3.78SDD293 pKa = 3.92VGVRR297 pKa = 11.84DD298 pKa = 3.54RR299 pKa = 11.84EE300 pKa = 4.21RR301 pKa = 11.84RR302 pKa = 11.84CAAAVVHH309 pKa = 6.6LVLL312 pKa = 5.72
Molecular weight: 31.64 kDa
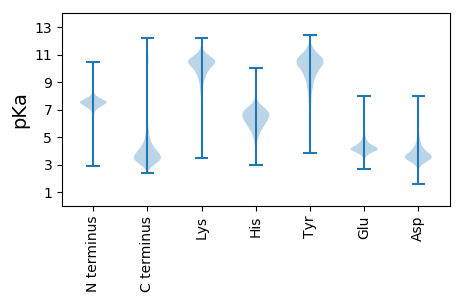
Isoelectric point according different methods:
Protein with the highest isoelectric point:
>tr|K5WED9|K5WED9_PHACS Uncharacterized protein OS=Phanerochaete carnosa (strain HHB-10118-sp) OX=650164 GN=PHACADRAFT_206348 PE=4 SV=1
MM1 pKa = 6.84VRR3 pKa = 11.84AARR6 pKa = 11.84LVLILPRR13 pKa = 11.84TVPRR17 pKa = 11.84SVPGTTTRR25 pKa = 11.84PIVRR29 pKa = 11.84GSTTSSAPASTTPATTSTMPASASRR54 pKa = 11.84VV55 pKa = 3.47
MM1 pKa = 6.84VRR3 pKa = 11.84AARR6 pKa = 11.84LVLILPRR13 pKa = 11.84TVPRR17 pKa = 11.84SVPGTTTRR25 pKa = 11.84PIVRR29 pKa = 11.84GSTTSSAPASTTPATTSTMPASASRR54 pKa = 11.84VV55 pKa = 3.47
Molecular weight: 5.63 kDa
Isoelectric point according different methods:
Peptides (in silico digests for buttom-up proteomics)
Below you can find in silico digests of the whole proteome with Trypsin, Chymotrypsin, Trypsin+LysC, LysN, ArgC proteases suitable for different mass spec machines.| Try ESI |
 |
|---|
| ChTry ESI |
 |
|---|
| ArgC ESI |
 |
|---|
| LysN ESI |
 |
|---|
| TryLysC ESI |
 |
|---|
| Try MALDI |
 |
|---|
| ChTry MALDI |
 |
|---|
| ArgC MALDI |
 |
|---|
| LysN MALDI |
 |
|---|
| TryLysC MALDI |
 |
|---|
| Try LTQ |
 |
|---|
| ChTry LTQ |
 |
|---|
| ArgC LTQ |
 |
|---|
| LysN LTQ |
 |
|---|
| TryLysC LTQ |
 |
|---|
| Try MSlow |
 |
|---|
| ChTry MSlow |
 |
|---|
| ArgC MSlow |
 |
|---|
| LysN MSlow |
 |
|---|
| TryLysC MSlow |
 |
|---|
| Try MShigh |
 |
|---|
| ChTry MShigh |
 |
|---|
| ArgC MShigh |
 |
|---|
| LysN MShigh |
 |
|---|
| TryLysC MShigh |
 |
|---|
General Statistics
Number of major isoforms |
Number of additional isoforms |
Number of all proteins |
Number of amino acids |
Min. Seq. Length |
Max. Seq. Length |
Avg. Seq. Length |
Avg. Mol. Weight |
|---|---|---|---|---|---|---|---|
0 |
5321648 |
49 |
3931 |
383.8 |
42.39 |
Amino acid frequency
Ala |
Cys |
Asp |
Glu |
Phe |
Gly |
His |
Ile |
Lys |
Leu |
|---|---|---|---|---|---|---|---|---|---|
9.159 ± 0.018 | 1.335 ± 0.009 |
5.547 ± 0.014 | 5.907 ± 0.022 |
3.74 ± 0.014 | 6.479 ± 0.017 |
2.6 ± 0.011 | 4.669 ± 0.013 |
4.256 ± 0.022 | 9.428 ± 0.023 |
Met |
Asn |
Gln |
Pro |
Arg |
Ser |
Thr |
Val |
Trp |
Tyr |
|---|---|---|---|---|---|---|---|---|---|
2.097 ± 0.007 | 3.191 ± 0.012 |
6.404 ± 0.023 | 3.755 ± 0.015 |
6.32 ± 0.018 | 8.312 ± 0.027 |
5.979 ± 0.015 | 6.627 ± 0.016 |
1.489 ± 0.008 | 2.706 ± 0.01 |
Most of the basic statistics you can see at this page can be downloaded from this CSV file
Proteome-pI is available under Creative Commons Attribution-NoDerivs license, for more details see here
| Reference: Kozlowski LP. Proteome-pI 2.0: Proteome Isoelectric Point Database Update. Nucleic Acids Res. 2021, doi: 10.1093/nar/gkab944 | Contact: Lukasz P. Kozlowski |
