Flavobacterium sp. LB1R34
Taxonomy: cellular organisms; Bacteria; FCB group; Bacteroidetes/Chlorobi group; Bacteroidetes; Flavobacteriia; Flavobacteriales; Flavobacteriaceae; Flavobacterium; unclassified Flavobacterium
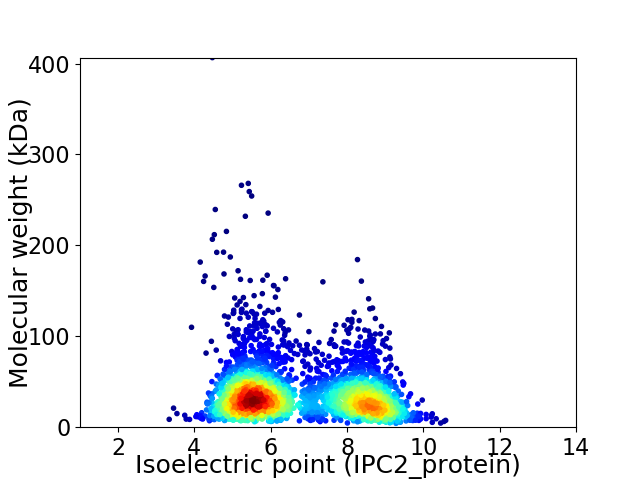
Average proteome isoelectric point is 6.74
Get precalculated fractions of proteins

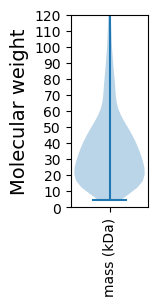
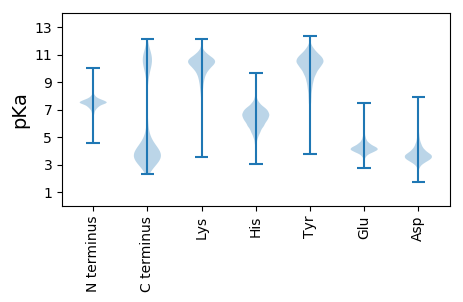
Virtual 2D-PAGE plot for 3141 proteins (isoelectric point calculated using IPC2_protein)
Get csv file with sequences according to given criteria:
* You can choose from 21 different methods for calculating isoelectric point
Summary statistics related to proteome-wise predictions


Protein with the lowest isoelectric point:
>tr|A0A553E8K0|A0A553E8K0_9FLAO Uncharacterized protein OS=Flavobacterium sp. LB1R34 OX=2594428 GN=FNW21_04560 PE=4 SV=1
MM1 pKa = 7.2VYY3 pKa = 10.24KK4 pKa = 10.58FRR6 pKa = 11.84VILDD10 pKa = 3.42AEE12 pKa = 4.04EE13 pKa = 5.63DD14 pKa = 3.42IFRR17 pKa = 11.84DD18 pKa = 3.48IAILEE23 pKa = 4.6DD24 pKa = 3.77DD25 pKa = 4.13TLEE28 pKa = 4.56DD29 pKa = 3.14LHH31 pKa = 7.78NAIFNSFGFDD41 pKa = 3.19GMEE44 pKa = 3.67VASFYY49 pKa = 11.0TCDD52 pKa = 3.51EE53 pKa = 4.1TWNQEE58 pKa = 3.85DD59 pKa = 5.24EE60 pKa = 4.6IPMFDD65 pKa = 3.3TGDD68 pKa = 3.27IPGEE72 pKa = 4.03QKK74 pKa = 9.82TMSDD78 pKa = 4.07YY79 pKa = 10.96ILSEE83 pKa = 4.0ILDD86 pKa = 3.75KK87 pKa = 11.5QNTKK91 pKa = 10.09IIYY94 pKa = 9.9VYY96 pKa = 10.91DD97 pKa = 5.09FINMWTFLVEE107 pKa = 3.97LAAVEE112 pKa = 4.15DD113 pKa = 4.11QVAGNMYY120 pKa = 9.91PEE122 pKa = 5.08TIFSHH127 pKa = 7.86GEE129 pKa = 3.86MPDD132 pKa = 3.02EE133 pKa = 4.28AMEE136 pKa = 4.54KK137 pKa = 10.39NFEE140 pKa = 4.28ADD142 pKa = 3.14MHH144 pKa = 6.64DD145 pKa = 4.5DD146 pKa = 3.19IYY148 pKa = 11.63GEE150 pKa = 4.38FEE152 pKa = 5.39DD153 pKa = 6.28DD154 pKa = 5.21LDD156 pKa = 5.18EE157 pKa = 6.67DD158 pKa = 4.46DD159 pKa = 6.43LDD161 pKa = 4.11MFSGDD166 pKa = 4.99DD167 pKa = 3.5SFEE170 pKa = 4.49DD171 pKa = 4.77FGFEE175 pKa = 4.53EE176 pKa = 4.36NWNN179 pKa = 3.64
MM1 pKa = 7.2VYY3 pKa = 10.24KK4 pKa = 10.58FRR6 pKa = 11.84VILDD10 pKa = 3.42AEE12 pKa = 4.04EE13 pKa = 5.63DD14 pKa = 3.42IFRR17 pKa = 11.84DD18 pKa = 3.48IAILEE23 pKa = 4.6DD24 pKa = 3.77DD25 pKa = 4.13TLEE28 pKa = 4.56DD29 pKa = 3.14LHH31 pKa = 7.78NAIFNSFGFDD41 pKa = 3.19GMEE44 pKa = 3.67VASFYY49 pKa = 11.0TCDD52 pKa = 3.51EE53 pKa = 4.1TWNQEE58 pKa = 3.85DD59 pKa = 5.24EE60 pKa = 4.6IPMFDD65 pKa = 3.3TGDD68 pKa = 3.27IPGEE72 pKa = 4.03QKK74 pKa = 9.82TMSDD78 pKa = 4.07YY79 pKa = 10.96ILSEE83 pKa = 4.0ILDD86 pKa = 3.75KK87 pKa = 11.5QNTKK91 pKa = 10.09IIYY94 pKa = 9.9VYY96 pKa = 10.91DD97 pKa = 5.09FINMWTFLVEE107 pKa = 3.97LAAVEE112 pKa = 4.15DD113 pKa = 4.11QVAGNMYY120 pKa = 9.91PEE122 pKa = 5.08TIFSHH127 pKa = 7.86GEE129 pKa = 3.86MPDD132 pKa = 3.02EE133 pKa = 4.28AMEE136 pKa = 4.54KK137 pKa = 10.39NFEE140 pKa = 4.28ADD142 pKa = 3.14MHH144 pKa = 6.64DD145 pKa = 4.5DD146 pKa = 3.19IYY148 pKa = 11.63GEE150 pKa = 4.38FEE152 pKa = 5.39DD153 pKa = 6.28DD154 pKa = 5.21LDD156 pKa = 5.18EE157 pKa = 6.67DD158 pKa = 4.46DD159 pKa = 6.43LDD161 pKa = 4.11MFSGDD166 pKa = 4.99DD167 pKa = 3.5SFEE170 pKa = 4.49DD171 pKa = 4.77FGFEE175 pKa = 4.53EE176 pKa = 4.36NWNN179 pKa = 3.64
Molecular weight: 20.95 kDa
Isoelectric point according different methods:
Protein with the highest isoelectric point:
>tr|A0A553DQI8|A0A553DQI8_9FLAO Alpha-amylase OS=Flavobacterium sp. LB1R34 OX=2594428 GN=FNW21_15630 PE=4 SV=1
MM1 pKa = 7.58PPKK4 pKa = 10.22KK5 pKa = 9.96RR6 pKa = 11.84AAKK9 pKa = 10.27KK10 pKa = 9.08NGSSFFVVCVPSLHH24 pKa = 5.61TVAPFVRR31 pKa = 11.84RR32 pKa = 11.84GYY34 pKa = 10.83CVFFSTIFFLFLSVEE49 pKa = 4.0NFQLKK54 pKa = 10.29KK55 pKa = 10.59NSPKK59 pKa = 10.49KK60 pKa = 9.57STATCVLAVAQPPAINLNRR79 pKa = 11.84NAKK82 pKa = 10.26ADD84 pKa = 3.83LNYY87 pKa = 10.45LFRR90 pKa = 11.84YY91 pKa = 9.91RR92 pKa = 11.84FTSSVAVTRR101 pKa = 11.84SHH103 pKa = 7.1PSSPEE108 pKa = 3.31KK109 pKa = 10.62GLPSLRR115 pKa = 11.84WLSVTATPPLVQQKK129 pKa = 10.26KK130 pKa = 10.12AFYY133 pKa = 10.06RR134 pKa = 11.84CC135 pKa = 3.4
MM1 pKa = 7.58PPKK4 pKa = 10.22KK5 pKa = 9.96RR6 pKa = 11.84AAKK9 pKa = 10.27KK10 pKa = 9.08NGSSFFVVCVPSLHH24 pKa = 5.61TVAPFVRR31 pKa = 11.84RR32 pKa = 11.84GYY34 pKa = 10.83CVFFSTIFFLFLSVEE49 pKa = 4.0NFQLKK54 pKa = 10.29KK55 pKa = 10.59NSPKK59 pKa = 10.49KK60 pKa = 9.57STATCVLAVAQPPAINLNRR79 pKa = 11.84NAKK82 pKa = 10.26ADD84 pKa = 3.83LNYY87 pKa = 10.45LFRR90 pKa = 11.84YY91 pKa = 9.91RR92 pKa = 11.84FTSSVAVTRR101 pKa = 11.84SHH103 pKa = 7.1PSSPEE108 pKa = 3.31KK109 pKa = 10.62GLPSLRR115 pKa = 11.84WLSVTATPPLVQQKK129 pKa = 10.26KK130 pKa = 10.12AFYY133 pKa = 10.06RR134 pKa = 11.84CC135 pKa = 3.4
Molecular weight: 15.16 kDa
Isoelectric point according different methods:
Peptides (in silico digests for buttom-up proteomics)
Below you can find in silico digests of the whole proteome with Trypsin, Chymotrypsin, Trypsin+LysC, LysN, ArgC proteases suitable for different mass spec machines.| Try ESI |
 |
|---|
| ChTry ESI |
 |
|---|
| ArgC ESI |
 |
|---|
| LysN ESI |
 |
|---|
| TryLysC ESI |
 |
|---|
| Try MALDI |
 |
|---|
| ChTry MALDI |
 |
|---|
| ArgC MALDI |
 |
|---|
| LysN MALDI |
 |
|---|
| TryLysC MALDI |
 |
|---|
| Try LTQ |
 |
|---|
| ChTry LTQ |
 |
|---|
| ArgC LTQ |
 |
|---|
| LysN LTQ |
 |
|---|
| TryLysC LTQ |
 |
|---|
| Try MSlow |
 |
|---|
| ChTry MSlow |
 |
|---|
| ArgC MSlow |
 |
|---|
| LysN MSlow |
 |
|---|
| TryLysC MSlow |
 |
|---|
| Try MShigh |
 |
|---|
| ChTry MShigh |
 |
|---|
| ArgC MShigh |
 |
|---|
| LysN MShigh |
 |
|---|
| TryLysC MShigh |
 |
|---|
General Statistics
Number of major isoforms |
Number of additional isoforms |
Number of all proteins |
Number of amino acids |
Min. Seq. Length |
Max. Seq. Length |
Avg. Seq. Length |
Avg. Mol. Weight |
|---|---|---|---|---|---|---|---|
0 |
1086059 |
36 |
3959 |
345.8 |
38.86 |
Amino acid frequency
Ala |
Cys |
Asp |
Glu |
Phe |
Gly |
His |
Ile |
Lys |
Leu |
|---|---|---|---|---|---|---|---|---|---|
6.84 ± 0.045 | 0.784 ± 0.013 |
5.169 ± 0.033 | 5.993 ± 0.055 |
5.325 ± 0.04 | 6.33 ± 0.047 |
1.656 ± 0.019 | 8.073 ± 0.045 |
7.911 ± 0.062 | 9.229 ± 0.049 |
Met |
Asn |
Gln |
Pro |
Arg |
Ser |
Thr |
Val |
Trp |
Tyr |
|---|---|---|---|---|---|---|---|---|---|
2.158 ± 0.023 | 6.362 ± 0.043 |
3.388 ± 0.023 | 3.618 ± 0.023 |
3.015 ± 0.026 | 6.345 ± 0.042 |
6.489 ± 0.079 | 6.203 ± 0.035 |
1.054 ± 0.017 | 4.058 ± 0.031 |
Most of the basic statistics you can see at this page can be downloaded from this CSV file
Proteome-pI is available under Creative Commons Attribution-NoDerivs license, for more details see here
| Reference: Kozlowski LP. Proteome-pI 2.0: Proteome Isoelectric Point Database Update. Nucleic Acids Res. 2021, doi: 10.1093/nar/gkab944 | Contact: Lukasz P. Kozlowski |
