candidate division MSBL1 archaeon SCGC-AAA259E17
Taxonomy: cellular organisms; Archaea; Euryarchaeota; Euryarchaeota incertae sedis; candidate division MSBL1
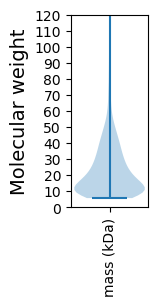
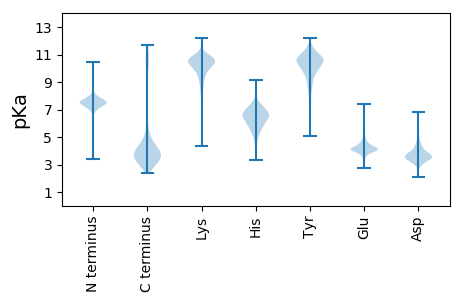
Average proteome isoelectric point is 6.2
Get precalculated fractions of proteins

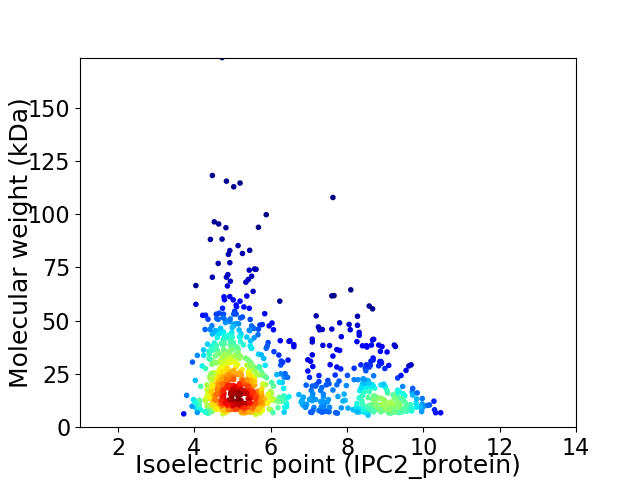
Virtual 2D-PAGE plot for 891 proteins (isoelectric point calculated using IPC2_protein)
Get csv file with sequences according to given criteria:
* You can choose from 21 different methods for calculating isoelectric point
Summary statistics related to proteome-wise predictions


Protein with the lowest isoelectric point:
>tr|A0A133UFQ5|A0A133UFQ5_9EURY DEDD_Tnp_IS110 domain-containing protein OS=candidate division MSBL1 archaeon SCGC-AAA259E17 OX=1698263 GN=AKJ64_01495 PE=4 SV=1
MM1 pKa = 7.51GFGAALGVALGEE13 pKa = 4.42DD14 pKa = 3.12AGEE17 pKa = 4.21TVRR20 pKa = 11.84IADD23 pKa = 4.25AEE25 pKa = 4.66DD26 pKa = 3.18ISGGVTAEE34 pKa = 3.98LACYY38 pKa = 10.02DD39 pKa = 3.42RR40 pKa = 11.84WTLLIHH46 pKa = 5.6VAGAIDD52 pKa = 3.69VTVEE56 pKa = 3.94LSPDD60 pKa = 3.77GKK62 pKa = 9.87ATWYY66 pKa = 10.32EE67 pKa = 3.92IDD69 pKa = 3.91EE70 pKa = 4.44SPYY73 pKa = 10.86SYY75 pKa = 11.05GAAGDD80 pKa = 3.92STNEE84 pKa = 3.73LGYY87 pKa = 10.7DD88 pKa = 3.31ATHH91 pKa = 6.73IRR93 pKa = 11.84LTGSNATSVTAQIRR107 pKa = 11.84GVWW110 pKa = 3.13
MM1 pKa = 7.51GFGAALGVALGEE13 pKa = 4.42DD14 pKa = 3.12AGEE17 pKa = 4.21TVRR20 pKa = 11.84IADD23 pKa = 4.25AEE25 pKa = 4.66DD26 pKa = 3.18ISGGVTAEE34 pKa = 3.98LACYY38 pKa = 10.02DD39 pKa = 3.42RR40 pKa = 11.84WTLLIHH46 pKa = 5.6VAGAIDD52 pKa = 3.69VTVEE56 pKa = 3.94LSPDD60 pKa = 3.77GKK62 pKa = 9.87ATWYY66 pKa = 10.32EE67 pKa = 3.92IDD69 pKa = 3.91EE70 pKa = 4.44SPYY73 pKa = 10.86SYY75 pKa = 11.05GAAGDD80 pKa = 3.92STNEE84 pKa = 3.73LGYY87 pKa = 10.7DD88 pKa = 3.31ATHH91 pKa = 6.73IRR93 pKa = 11.84LTGSNATSVTAQIRR107 pKa = 11.84GVWW110 pKa = 3.13
Molecular weight: 11.47 kDa
Isoelectric point according different methods:
Protein with the highest isoelectric point:
>tr|A0A133UFL5|A0A133UFL5_9EURY Uncharacterized protein OS=candidate division MSBL1 archaeon SCGC-AAA259E17 OX=1698263 GN=AKJ64_01650 PE=4 SV=1
MM1 pKa = 7.72ISILIAYY8 pKa = 7.24PLTVGVVSVIVGFRR22 pKa = 11.84HH23 pKa = 6.23LFKK26 pKa = 10.59HH27 pKa = 5.62RR28 pKa = 11.84HH29 pKa = 4.82LHH31 pKa = 5.11LQQLGEE37 pKa = 4.03LHH39 pKa = 6.68ALRR42 pKa = 11.84LFRR45 pKa = 11.84HH46 pKa = 6.51CDD48 pKa = 3.39VVPDD52 pKa = 4.13DD53 pKa = 5.48FIDD56 pKa = 4.3GVARR60 pKa = 11.84SSTLHH65 pKa = 5.42SHH67 pKa = 6.12LQIGQLFLIGFRR79 pKa = 11.84SQSPRR84 pKa = 11.84RR85 pKa = 11.84LLVPRR90 pKa = 11.84FPDD93 pKa = 3.05IQQMFKK99 pKa = 10.41PIEE102 pKa = 3.79HH103 pKa = 6.5SRR105 pKa = 11.84RR106 pKa = 11.84ILRR109 pKa = 11.84DD110 pKa = 3.07GLYY113 pKa = 10.09SEE115 pKa = 5.1KK116 pKa = 10.65LQEE119 pKa = 3.96ILKK122 pKa = 10.53LILNIAWGSAVSGYY136 pKa = 9.57LLKK139 pKa = 10.68RR140 pKa = 11.84RR141 pKa = 11.84LLL143 pKa = 3.93
MM1 pKa = 7.72ISILIAYY8 pKa = 7.24PLTVGVVSVIVGFRR22 pKa = 11.84HH23 pKa = 6.23LFKK26 pKa = 10.59HH27 pKa = 5.62RR28 pKa = 11.84HH29 pKa = 4.82LHH31 pKa = 5.11LQQLGEE37 pKa = 4.03LHH39 pKa = 6.68ALRR42 pKa = 11.84LFRR45 pKa = 11.84HH46 pKa = 6.51CDD48 pKa = 3.39VVPDD52 pKa = 4.13DD53 pKa = 5.48FIDD56 pKa = 4.3GVARR60 pKa = 11.84SSTLHH65 pKa = 5.42SHH67 pKa = 6.12LQIGQLFLIGFRR79 pKa = 11.84SQSPRR84 pKa = 11.84RR85 pKa = 11.84LLVPRR90 pKa = 11.84FPDD93 pKa = 3.05IQQMFKK99 pKa = 10.41PIEE102 pKa = 3.79HH103 pKa = 6.5SRR105 pKa = 11.84RR106 pKa = 11.84ILRR109 pKa = 11.84DD110 pKa = 3.07GLYY113 pKa = 10.09SEE115 pKa = 5.1KK116 pKa = 10.65LQEE119 pKa = 3.96ILKK122 pKa = 10.53LILNIAWGSAVSGYY136 pKa = 9.57LLKK139 pKa = 10.68RR140 pKa = 11.84RR141 pKa = 11.84LLL143 pKa = 3.93
Molecular weight: 16.55 kDa
Isoelectric point according different methods:
Peptides (in silico digests for buttom-up proteomics)
Below you can find in silico digests of the whole proteome with Trypsin, Chymotrypsin, Trypsin+LysC, LysN, ArgC proteases suitable for different mass spec machines.| Try ESI |
 |
|---|
| ChTry ESI |
 |
|---|
| ArgC ESI |
 |
|---|
| LysN ESI |
 |
|---|
| TryLysC ESI |
 |
|---|
| Try MALDI |
 |
|---|
| ChTry MALDI |
 |
|---|
| ArgC MALDI |
 |
|---|
| LysN MALDI |
 |
|---|
| TryLysC MALDI |
 |
|---|
| Try LTQ |
 |
|---|
| ChTry LTQ |
 |
|---|
| ArgC LTQ |
 |
|---|
| LysN LTQ |
 |
|---|
| TryLysC LTQ |
 |
|---|
| Try MSlow |
 |
|---|
| ChTry MSlow |
 |
|---|
| ArgC MSlow |
 |
|---|
| LysN MSlow |
 |
|---|
| TryLysC MSlow |
 |
|---|
| Try MShigh |
 |
|---|
| ChTry MShigh |
 |
|---|
| ArgC MShigh |
 |
|---|
| LysN MShigh |
 |
|---|
| TryLysC MShigh |
 |
|---|
General Statistics
Number of major isoforms |
Number of additional isoforms |
Number of all proteins |
Number of amino acids |
Min. Seq. Length |
Max. Seq. Length |
Avg. Seq. Length |
Avg. Mol. Weight |
|---|---|---|---|---|---|---|---|
0 |
190103 |
52 |
1524 |
213.4 |
24.12 |
Amino acid frequency
Ala |
Cys |
Asp |
Glu |
Phe |
Gly |
His |
Ile |
Lys |
Leu |
|---|---|---|---|---|---|---|---|---|---|
5.927 ± 0.099 | 0.991 ± 0.037 |
5.827 ± 0.086 | 10.646 ± 0.123 |
3.874 ± 0.065 | 7.445 ± 0.086 |
1.711 ± 0.029 | 6.41 ± 0.076 |
7.298 ± 0.095 | 9.218 ± 0.09 |
Met |
Asn |
Gln |
Pro |
Arg |
Ser |
Thr |
Val |
Trp |
Tyr |
|---|---|---|---|---|---|---|---|---|---|
2.197 ± 0.05 | 3.642 ± 0.063 |
4.216 ± 0.057 | 2.255 ± 0.037 |
6.245 ± 0.083 | 6.591 ± 0.077 |
4.57 ± 0.059 | 6.736 ± 0.087 |
1.265 ± 0.033 | 2.938 ± 0.052 |
Most of the basic statistics you can see at this page can be downloaded from this CSV file
Proteome-pI is available under Creative Commons Attribution-NoDerivs license, for more details see here
| Reference: Kozlowski LP. Proteome-pI 2.0: Proteome Isoelectric Point Database Update. Nucleic Acids Res. 2021, doi: 10.1093/nar/gkab944 | Contact: Lukasz P. Kozlowski |
