Permianibacter aggregans
Taxonomy: cellular organisms; Bacteria; Proteobacteria; Gammaproteobacteria; Pseudomonadales; Pseudomonadaceae; Permianibacter
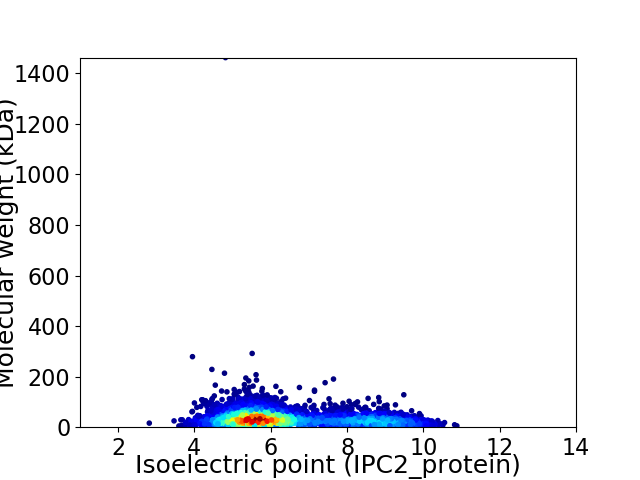
Average proteome isoelectric point is 6.44
Get precalculated fractions of proteins

Virtual 2D-PAGE plot for 3735 proteins (isoelectric point calculated using IPC2_protein)
Get csv file with sequences according to given criteria:
* You can choose from 21 different methods for calculating isoelectric point
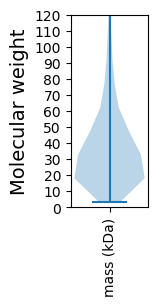
Summary statistics related to proteome-wise predictions


Protein with the lowest isoelectric point:
>tr|A0A4R6UMW3|A0A4R6UMW3_9GAMM Uncharacterized protein OS=Permianibacter aggregans OX=1510150 GN=EV696_11346 PE=4 SV=1
MM1 pKa = 7.51KK2 pKa = 9.5MKK4 pKa = 10.26KK5 pKa = 10.07VFGAAVLAIASMVSHH20 pKa = 6.68SAFADD25 pKa = 4.76LILPTDD31 pKa = 3.91PLVKK35 pKa = 9.89TNHH38 pKa = 6.68PSLNTGNVGGDD49 pKa = 3.66PVSIAATSGCASSDD63 pKa = 3.65YY64 pKa = 10.26CTLTEE69 pKa = 5.13LINGGSLSAGGLTFGNFNLDD89 pKa = 2.88FDD91 pKa = 4.85FGYY94 pKa = 11.3GDD96 pKa = 5.65ALDD99 pKa = 4.33TDD101 pKa = 4.53NVWVRR106 pKa = 11.84VFDD109 pKa = 3.92FGGAIMLDD117 pKa = 3.66YY118 pKa = 11.28DD119 pKa = 4.33FAPLGFGGPLPTLLSGEE136 pKa = 3.88ASGFIDD142 pKa = 4.01LSYY145 pKa = 11.32SVVSDD150 pKa = 3.35SSVDD154 pKa = 4.16IFAAWLWDD162 pKa = 3.66MIGAGTADD170 pKa = 4.3ADD172 pKa = 3.98YY173 pKa = 10.97EE174 pKa = 4.35LQFDD178 pKa = 3.73MTLFDD183 pKa = 5.37GDD185 pKa = 3.81TEE187 pKa = 4.19LAYY190 pKa = 10.72LYY192 pKa = 10.45LYY194 pKa = 10.89SLLEE198 pKa = 4.25NNSVIDD204 pKa = 4.25SDD206 pKa = 5.07ADD208 pKa = 3.59DD209 pKa = 4.4LAIFAALNSLNVWNSISAISYY230 pKa = 8.47EE231 pKa = 4.02GLNLFYY237 pKa = 10.51IGDD240 pKa = 3.46QMFFTEE246 pKa = 4.75VTQVPAPFTVLLFGFGLAALGLRR269 pKa = 11.84KK270 pKa = 9.3RR271 pKa = 11.84VRR273 pKa = 3.23
MM1 pKa = 7.51KK2 pKa = 9.5MKK4 pKa = 10.26KK5 pKa = 10.07VFGAAVLAIASMVSHH20 pKa = 6.68SAFADD25 pKa = 4.76LILPTDD31 pKa = 3.91PLVKK35 pKa = 9.89TNHH38 pKa = 6.68PSLNTGNVGGDD49 pKa = 3.66PVSIAATSGCASSDD63 pKa = 3.65YY64 pKa = 10.26CTLTEE69 pKa = 5.13LINGGSLSAGGLTFGNFNLDD89 pKa = 2.88FDD91 pKa = 4.85FGYY94 pKa = 11.3GDD96 pKa = 5.65ALDD99 pKa = 4.33TDD101 pKa = 4.53NVWVRR106 pKa = 11.84VFDD109 pKa = 3.92FGGAIMLDD117 pKa = 3.66YY118 pKa = 11.28DD119 pKa = 4.33FAPLGFGGPLPTLLSGEE136 pKa = 3.88ASGFIDD142 pKa = 4.01LSYY145 pKa = 11.32SVVSDD150 pKa = 3.35SSVDD154 pKa = 4.16IFAAWLWDD162 pKa = 3.66MIGAGTADD170 pKa = 4.3ADD172 pKa = 3.98YY173 pKa = 10.97EE174 pKa = 4.35LQFDD178 pKa = 3.73MTLFDD183 pKa = 5.37GDD185 pKa = 3.81TEE187 pKa = 4.19LAYY190 pKa = 10.72LYY192 pKa = 10.45LYY194 pKa = 10.89SLLEE198 pKa = 4.25NNSVIDD204 pKa = 4.25SDD206 pKa = 5.07ADD208 pKa = 3.59DD209 pKa = 4.4LAIFAALNSLNVWNSISAISYY230 pKa = 8.47EE231 pKa = 4.02GLNLFYY237 pKa = 10.51IGDD240 pKa = 3.46QMFFTEE246 pKa = 4.75VTQVPAPFTVLLFGFGLAALGLRR269 pKa = 11.84KK270 pKa = 9.3RR271 pKa = 11.84VRR273 pKa = 3.23
Molecular weight: 29.14 kDa
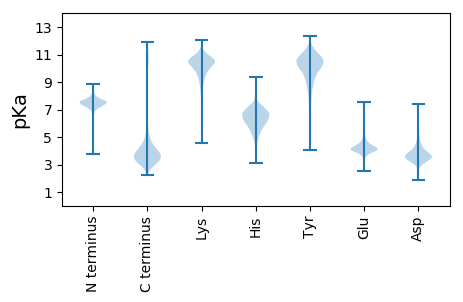
Isoelectric point according different methods:
Protein with the highest isoelectric point:
>tr|A0A4R6UD45|A0A4R6UD45_9GAMM Citrate lyase subunit beta/citryl-CoA lyase OS=Permianibacter aggregans OX=1510150 GN=EV696_13315 PE=4 SV=1
MM1 pKa = 7.45KK2 pKa = 9.61RR3 pKa = 11.84TFQPSNLKK11 pKa = 10.17KK12 pKa = 10.64KK13 pKa = 9.6RR14 pKa = 11.84DD15 pKa = 3.36HH16 pKa = 6.55GFRR19 pKa = 11.84ARR21 pKa = 11.84MATKK25 pKa = 10.39NGRR28 pKa = 11.84LVLKK32 pKa = 10.32RR33 pKa = 11.84RR34 pKa = 11.84RR35 pKa = 11.84AKK37 pKa = 9.6GRR39 pKa = 11.84KK40 pKa = 8.83RR41 pKa = 11.84LTVVV45 pKa = 3.08
MM1 pKa = 7.45KK2 pKa = 9.61RR3 pKa = 11.84TFQPSNLKK11 pKa = 10.17KK12 pKa = 10.64KK13 pKa = 9.6RR14 pKa = 11.84DD15 pKa = 3.36HH16 pKa = 6.55GFRR19 pKa = 11.84ARR21 pKa = 11.84MATKK25 pKa = 10.39NGRR28 pKa = 11.84LVLKK32 pKa = 10.32RR33 pKa = 11.84RR34 pKa = 11.84RR35 pKa = 11.84AKK37 pKa = 9.6GRR39 pKa = 11.84KK40 pKa = 8.83RR41 pKa = 11.84LTVVV45 pKa = 3.08
Molecular weight: 5.39 kDa
Isoelectric point according different methods:
Peptides (in silico digests for buttom-up proteomics)
Below you can find in silico digests of the whole proteome with Trypsin, Chymotrypsin, Trypsin+LysC, LysN, ArgC proteases suitable for different mass spec machines.| Try ESI |
 |
|---|
| ChTry ESI |
 |
|---|
| ArgC ESI |
 |
|---|
| LysN ESI |
 |
|---|
| TryLysC ESI |
 |
|---|
| Try MALDI |
 |
|---|
| ChTry MALDI |
 |
|---|
| ArgC MALDI |
 |
|---|
| LysN MALDI |
 |
|---|
| TryLysC MALDI |
 |
|---|
| Try LTQ |
 |
|---|
| ChTry LTQ |
 |
|---|
| ArgC LTQ |
 |
|---|
| LysN LTQ |
 |
|---|
| TryLysC LTQ |
 |
|---|
| Try MSlow |
 |
|---|
| ChTry MSlow |
 |
|---|
| ArgC MSlow |
 |
|---|
| LysN MSlow |
 |
|---|
| TryLysC MSlow |
 |
|---|
| Try MShigh |
 |
|---|
| ChTry MShigh |
 |
|---|
| ArgC MShigh |
 |
|---|
| LysN MShigh |
 |
|---|
| TryLysC MShigh |
 |
|---|
General Statistics
Number of major isoforms |
Number of additional isoforms |
Number of all proteins |
Number of amino acids |
Min. Seq. Length |
Max. Seq. Length |
Avg. Seq. Length |
Avg. Mol. Weight |
|---|---|---|---|---|---|---|---|
0 |
1253671 |
31 |
13667 |
335.7 |
37.23 |
Amino acid frequency
Ala |
Cys |
Asp |
Glu |
Phe |
Gly |
His |
Ile |
Lys |
Leu |
|---|---|---|---|---|---|---|---|---|---|
10.264 ± 0.046 | 0.932 ± 0.016 |
5.347 ± 0.029 | 6.078 ± 0.042 |
3.937 ± 0.029 | 7.014 ± 0.047 |
2.404 ± 0.02 | 5.262 ± 0.026 |
4.055 ± 0.04 | 10.943 ± 0.06 |
Met |
Asn |
Gln |
Pro |
Arg |
Ser |
Thr |
Val |
Trp |
Tyr |
|---|---|---|---|---|---|---|---|---|---|
2.43 ± 0.025 | 3.489 ± 0.035 |
4.562 ± 0.024 | 4.92 ± 0.038 |
6.177 ± 0.035 | 5.995 ± 0.042 |
4.995 ± 0.033 | 6.984 ± 0.037 |
1.528 ± 0.021 | 2.684 ± 0.023 |
Most of the basic statistics you can see at this page can be downloaded from this CSV file
Proteome-pI is available under Creative Commons Attribution-NoDerivs license, for more details see here
| Reference: Kozlowski LP. Proteome-pI 2.0: Proteome Isoelectric Point Database Update. Nucleic Acids Res. 2021, doi: 10.1093/nar/gkab944 | Contact: Lukasz P. Kozlowski |
