Alloprevotella sp. OH1205_COT-284
Taxonomy: cellular organisms; Bacteria; FCB group; Bacteroidetes/Chlorobi group; Bacteroidetes; Bacteroidia; Bacteroidales; Prevotellaceae; Alloprevotella; unclassified Alloprevotella
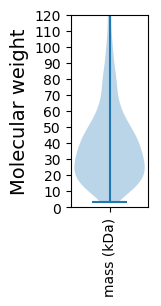
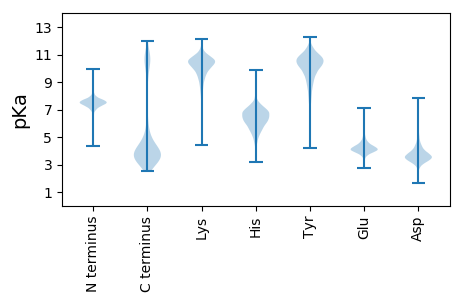
Average proteome isoelectric point is 6.77
Get precalculated fractions of proteins

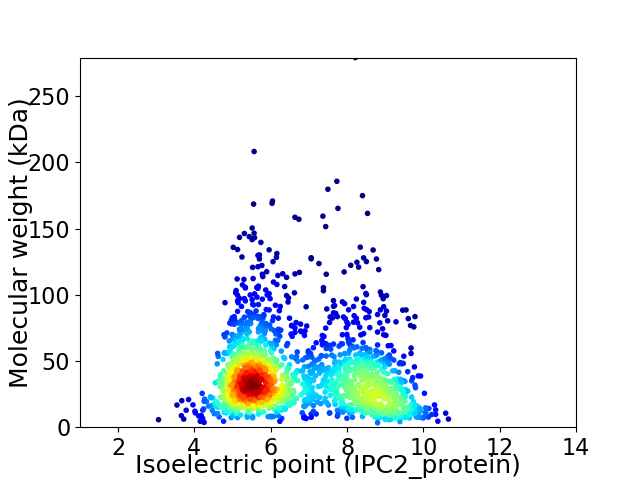
Virtual 2D-PAGE plot for 1708 proteins (isoelectric point calculated using IPC2_protein)
Get csv file with sequences according to given criteria:
* You can choose from 21 different methods for calculating isoelectric point
Summary statistics related to proteome-wise predictions


Protein with the lowest isoelectric point:
>tr|A0A3P1Z4X1|A0A3P1Z4X1_9BACT Dipeptidase OS=Alloprevotella sp. OH1205_COT-284 OX=2491043 GN=EII14_06775 PE=4 SV=1
MM1 pKa = 7.41TGIFYY6 pKa = 10.79GSTTGNTEE14 pKa = 3.4AAAQEE19 pKa = 4.13IASALGVSSDD29 pKa = 3.18QVYY32 pKa = 10.68NVGEE36 pKa = 4.2VGADD40 pKa = 3.23TVAQFDD46 pKa = 4.05TLILGSSTWGCGDD59 pKa = 5.17LQDD62 pKa = 4.66DD63 pKa = 4.53WYY65 pKa = 10.9DD66 pKa = 4.18FLDD69 pKa = 3.46QLKK72 pKa = 10.55AQDD75 pKa = 3.94LSGKK79 pKa = 10.08RR80 pKa = 11.84IALFGCGDD88 pKa = 3.51SDD90 pKa = 4.32GYY92 pKa = 11.84ADD94 pKa = 4.15TFCGALAQIYY104 pKa = 9.03DD105 pKa = 3.83ALADD109 pKa = 3.62SGATFVGQVDD119 pKa = 3.55AAGIAATDD127 pKa = 3.67TEE129 pKa = 4.3ACRR132 pKa = 11.84DD133 pKa = 3.59GKK135 pKa = 10.87FVGLPIDD142 pKa = 4.33DD143 pKa = 5.32ADD145 pKa = 4.17PEE147 pKa = 4.42GNAARR152 pKa = 11.84MAAWVEE158 pKa = 4.36SVKK161 pKa = 11.01AA162 pKa = 3.72
MM1 pKa = 7.41TGIFYY6 pKa = 10.79GSTTGNTEE14 pKa = 3.4AAAQEE19 pKa = 4.13IASALGVSSDD29 pKa = 3.18QVYY32 pKa = 10.68NVGEE36 pKa = 4.2VGADD40 pKa = 3.23TVAQFDD46 pKa = 4.05TLILGSSTWGCGDD59 pKa = 5.17LQDD62 pKa = 4.66DD63 pKa = 4.53WYY65 pKa = 10.9DD66 pKa = 4.18FLDD69 pKa = 3.46QLKK72 pKa = 10.55AQDD75 pKa = 3.94LSGKK79 pKa = 10.08RR80 pKa = 11.84IALFGCGDD88 pKa = 3.51SDD90 pKa = 4.32GYY92 pKa = 11.84ADD94 pKa = 4.15TFCGALAQIYY104 pKa = 9.03DD105 pKa = 3.83ALADD109 pKa = 3.62SGATFVGQVDD119 pKa = 3.55AAGIAATDD127 pKa = 3.67TEE129 pKa = 4.3ACRR132 pKa = 11.84DD133 pKa = 3.59GKK135 pKa = 10.87FVGLPIDD142 pKa = 4.33DD143 pKa = 5.32ADD145 pKa = 4.17PEE147 pKa = 4.42GNAARR152 pKa = 11.84MAAWVEE158 pKa = 4.36SVKK161 pKa = 11.01AA162 pKa = 3.72
Molecular weight: 16.72 kDa
Isoelectric point according different methods:
Protein with the highest isoelectric point:
>tr|A0A3P1Z7Z7|A0A3P1Z7Z7_9BACT Sugar transferase OS=Alloprevotella sp. OH1205_COT-284 OX=2491043 GN=EII14_06125 PE=3 SV=1
MM1 pKa = 7.25TRR3 pKa = 11.84RR4 pKa = 11.84LSILLLGFAPLLASAQEE21 pKa = 4.37VGDD24 pKa = 4.05STLLRR29 pKa = 11.84PSLSTCAASICFPTRR44 pKa = 11.84FGSQTARR51 pKa = 11.84HH52 pKa = 5.89LRR54 pKa = 11.84HH55 pKa = 5.3EE56 pKa = 4.57AKK58 pKa = 10.23RR59 pKa = 11.84AAFSYY64 pKa = 10.54VRR66 pKa = 11.84ISRR69 pKa = 11.84FRR71 pKa = 11.84EE72 pKa = 3.89KK73 pKa = 10.44PFKK76 pKa = 10.84IPVTTPNASLKK87 pKa = 10.55DD88 pKa = 3.01IYY90 pKa = 11.24LRR92 pKa = 11.84FRR94 pKa = 11.84PKK96 pKa = 10.51RR97 pKa = 11.84NTDD100 pKa = 3.66FRR102 pKa = 11.84NCGEE106 pKa = 4.22IKK108 pKa = 10.71EE109 pKa = 4.31EE110 pKa = 4.04
MM1 pKa = 7.25TRR3 pKa = 11.84RR4 pKa = 11.84LSILLLGFAPLLASAQEE21 pKa = 4.37VGDD24 pKa = 4.05STLLRR29 pKa = 11.84PSLSTCAASICFPTRR44 pKa = 11.84FGSQTARR51 pKa = 11.84HH52 pKa = 5.89LRR54 pKa = 11.84HH55 pKa = 5.3EE56 pKa = 4.57AKK58 pKa = 10.23RR59 pKa = 11.84AAFSYY64 pKa = 10.54VRR66 pKa = 11.84ISRR69 pKa = 11.84FRR71 pKa = 11.84EE72 pKa = 3.89KK73 pKa = 10.44PFKK76 pKa = 10.84IPVTTPNASLKK87 pKa = 10.55DD88 pKa = 3.01IYY90 pKa = 11.24LRR92 pKa = 11.84FRR94 pKa = 11.84PKK96 pKa = 10.51RR97 pKa = 11.84NTDD100 pKa = 3.66FRR102 pKa = 11.84NCGEE106 pKa = 4.22IKK108 pKa = 10.71EE109 pKa = 4.31EE110 pKa = 4.04
Molecular weight: 12.54 kDa
Isoelectric point according different methods:
Peptides (in silico digests for buttom-up proteomics)
Below you can find in silico digests of the whole proteome with Trypsin, Chymotrypsin, Trypsin+LysC, LysN, ArgC proteases suitable for different mass spec machines.| Try ESI |
 |
|---|
| ChTry ESI |
 |
|---|
| ArgC ESI |
 |
|---|
| LysN ESI |
 |
|---|
| TryLysC ESI |
 |
|---|
| Try MALDI |
 |
|---|
| ChTry MALDI |
 |
|---|
| ArgC MALDI |
 |
|---|
| LysN MALDI |
 |
|---|
| TryLysC MALDI |
 |
|---|
| Try LTQ |
 |
|---|
| ChTry LTQ |
 |
|---|
| ArgC LTQ |
 |
|---|
| LysN LTQ |
 |
|---|
| TryLysC LTQ |
 |
|---|
| Try MSlow |
 |
|---|
| ChTry MSlow |
 |
|---|
| ArgC MSlow |
 |
|---|
| LysN MSlow |
 |
|---|
| TryLysC MSlow |
 |
|---|
| Try MShigh |
 |
|---|
| ChTry MShigh |
 |
|---|
| ArgC MShigh |
 |
|---|
| LysN MShigh |
 |
|---|
| TryLysC MShigh |
 |
|---|
General Statistics
Number of major isoforms |
Number of additional isoforms |
Number of all proteins |
Number of amino acids |
Min. Seq. Length |
Max. Seq. Length |
Avg. Seq. Length |
Avg. Mol. Weight |
|---|---|---|---|---|---|---|---|
0 |
634113 |
28 |
2462 |
371.3 |
41.74 |
Amino acid frequency
Ala |
Cys |
Asp |
Glu |
Phe |
Gly |
His |
Ile |
Lys |
Leu |
|---|---|---|---|---|---|---|---|---|---|
8.1 ± 0.056 | 1.182 ± 0.021 |
5.403 ± 0.037 | 6.563 ± 0.059 |
4.65 ± 0.04 | 6.857 ± 0.045 |
2.306 ± 0.031 | 6.059 ± 0.053 |
5.592 ± 0.055 | 9.629 ± 0.058 |
Met |
Asn |
Gln |
Pro |
Arg |
Ser |
Thr |
Val |
Trp |
Tyr |
|---|---|---|---|---|---|---|---|---|---|
2.504 ± 0.027 | 4.348 ± 0.044 |
4.0 ± 0.032 | 3.46 ± 0.03 |
6.042 ± 0.054 | 6.085 ± 0.045 |
5.742 ± 0.037 | 6.592 ± 0.042 |
1.173 ± 0.024 | 3.713 ± 0.04 |
Most of the basic statistics you can see at this page can be downloaded from this CSV file
Proteome-pI is available under Creative Commons Attribution-NoDerivs license, for more details see here
| Reference: Kozlowski LP. Proteome-pI 2.0: Proteome Isoelectric Point Database Update. Nucleic Acids Res. 2021, doi: 10.1093/nar/gkab944 | Contact: Lukasz P. Kozlowski |
