Streptomyces bingchenggensis (strain BCW-1)
Taxonomy: cellular organisms; Bacteria; Terrabacteria group; Actinobacteria; Actinomycetia; Streptomycetales; Streptomycetaceae; Streptomyces; Streptomyces bingchenggensis
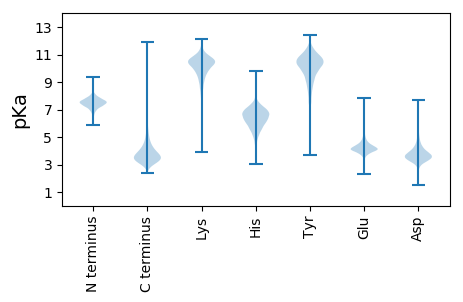
Average proteome isoelectric point is 6.43
Get precalculated fractions of proteins

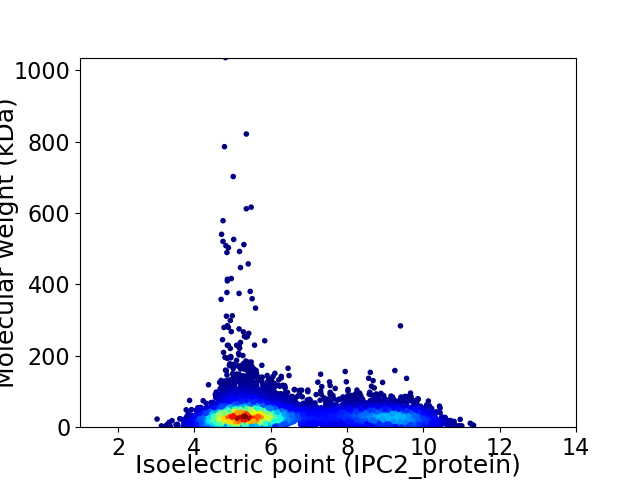
Virtual 2D-PAGE plot for 10019 proteins (isoelectric point calculated using IPC2_protein)
Get csv file with sequences according to given criteria:
* You can choose from 21 different methods for calculating isoelectric point
Summary statistics related to proteome-wise predictions


Protein with the lowest isoelectric point:
>tr|D7C2P5|D7C2P5_STRBB Uncharacterized protein OS=Streptomyces bingchenggensis (strain BCW-1) OX=749414 GN=SBI_02807 PE=4 SV=1
MM1 pKa = 7.82RR2 pKa = 11.84KK3 pKa = 9.62HH4 pKa = 6.55GIIAATSTLALALGGALFAAPAAQAATTVASVVHH38 pKa = 6.73EE39 pKa = 5.02DD40 pKa = 3.67SEE42 pKa = 4.43LWYY45 pKa = 10.65KK46 pKa = 10.36GAAGQTNNLKK56 pKa = 10.52VSVEE60 pKa = 3.67IEE62 pKa = 3.84QRR64 pKa = 11.84GEE66 pKa = 3.59WEE68 pKa = 4.06SYY70 pKa = 9.23YY71 pKa = 11.04VITFRR76 pKa = 11.84DD77 pKa = 3.49RR78 pKa = 11.84GDD80 pKa = 3.1ITIDD84 pKa = 3.27SSAAEE89 pKa = 4.29YY90 pKa = 10.69DD91 pKa = 3.54EE92 pKa = 4.36CTYY95 pKa = 11.02PSDD98 pKa = 3.85ADD100 pKa = 3.67HH101 pKa = 6.07TVVRR105 pKa = 11.84CATEE109 pKa = 4.11VPLGSDD115 pKa = 3.9DD116 pKa = 4.18SDD118 pKa = 3.97NYY120 pKa = 11.22DD121 pKa = 3.39VNLGDD126 pKa = 4.56GNDD129 pKa = 3.77TATVDD134 pKa = 3.87AGSDD138 pKa = 3.51AYY140 pKa = 10.2STIYY144 pKa = 10.22GGPGDD149 pKa = 5.06DD150 pKa = 3.68VLKK153 pKa = 11.07GSARR157 pKa = 11.84DD158 pKa = 3.59VLRR161 pKa = 11.84GDD163 pKa = 5.04DD164 pKa = 4.14GDD166 pKa = 4.45DD167 pKa = 3.54RR168 pKa = 11.84LDD170 pKa = 3.73GGGGVWGMGPYY181 pKa = 10.13GGPGDD186 pKa = 4.23DD187 pKa = 4.55TITNCSMDD195 pKa = 4.0CYY197 pKa = 10.57GGPGNDD203 pKa = 3.42SMSGGTNDD211 pKa = 4.55TEE213 pKa = 4.32NNMYY217 pKa = 10.85GEE219 pKa = 5.12DD220 pKa = 4.08GNDD223 pKa = 3.68VIHH226 pKa = 6.56GLSDD230 pKa = 3.49ADD232 pKa = 3.91HH233 pKa = 7.08IYY235 pKa = 10.81GGRR238 pKa = 11.84GNDD241 pKa = 3.26TLYY244 pKa = 11.3GEE246 pKa = 4.98EE247 pKa = 4.86GDD249 pKa = 3.73DD250 pKa = 3.69TIYY253 pKa = 11.3GNSGNDD259 pKa = 3.62TIHH262 pKa = 6.54GGKK265 pKa = 8.4GTDD268 pKa = 3.54TLSGGPGTNKK278 pKa = 9.57VYY280 pKa = 10.87QDD282 pKa = 3.16
MM1 pKa = 7.82RR2 pKa = 11.84KK3 pKa = 9.62HH4 pKa = 6.55GIIAATSTLALALGGALFAAPAAQAATTVASVVHH38 pKa = 6.73EE39 pKa = 5.02DD40 pKa = 3.67SEE42 pKa = 4.43LWYY45 pKa = 10.65KK46 pKa = 10.36GAAGQTNNLKK56 pKa = 10.52VSVEE60 pKa = 3.67IEE62 pKa = 3.84QRR64 pKa = 11.84GEE66 pKa = 3.59WEE68 pKa = 4.06SYY70 pKa = 9.23YY71 pKa = 11.04VITFRR76 pKa = 11.84DD77 pKa = 3.49RR78 pKa = 11.84GDD80 pKa = 3.1ITIDD84 pKa = 3.27SSAAEE89 pKa = 4.29YY90 pKa = 10.69DD91 pKa = 3.54EE92 pKa = 4.36CTYY95 pKa = 11.02PSDD98 pKa = 3.85ADD100 pKa = 3.67HH101 pKa = 6.07TVVRR105 pKa = 11.84CATEE109 pKa = 4.11VPLGSDD115 pKa = 3.9DD116 pKa = 4.18SDD118 pKa = 3.97NYY120 pKa = 11.22DD121 pKa = 3.39VNLGDD126 pKa = 4.56GNDD129 pKa = 3.77TATVDD134 pKa = 3.87AGSDD138 pKa = 3.51AYY140 pKa = 10.2STIYY144 pKa = 10.22GGPGDD149 pKa = 5.06DD150 pKa = 3.68VLKK153 pKa = 11.07GSARR157 pKa = 11.84DD158 pKa = 3.59VLRR161 pKa = 11.84GDD163 pKa = 5.04DD164 pKa = 4.14GDD166 pKa = 4.45DD167 pKa = 3.54RR168 pKa = 11.84LDD170 pKa = 3.73GGGGVWGMGPYY181 pKa = 10.13GGPGDD186 pKa = 4.23DD187 pKa = 4.55TITNCSMDD195 pKa = 4.0CYY197 pKa = 10.57GGPGNDD203 pKa = 3.42SMSGGTNDD211 pKa = 4.55TEE213 pKa = 4.32NNMYY217 pKa = 10.85GEE219 pKa = 5.12DD220 pKa = 4.08GNDD223 pKa = 3.68VIHH226 pKa = 6.56GLSDD230 pKa = 3.49ADD232 pKa = 3.91HH233 pKa = 7.08IYY235 pKa = 10.81GGRR238 pKa = 11.84GNDD241 pKa = 3.26TLYY244 pKa = 11.3GEE246 pKa = 4.98EE247 pKa = 4.86GDD249 pKa = 3.73DD250 pKa = 3.69TIYY253 pKa = 11.3GNSGNDD259 pKa = 3.62TIHH262 pKa = 6.54GGKK265 pKa = 8.4GTDD268 pKa = 3.54TLSGGPGTNKK278 pKa = 9.57VYY280 pKa = 10.87QDD282 pKa = 3.16
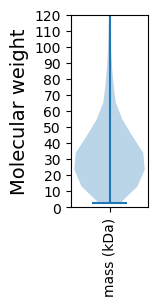
Molecular weight: 29.26 kDa
Isoelectric point according different methods:
Protein with the highest isoelectric point:
>tr|D7C9A5|D7C9A5_STRBB Ricin B-type lectin domain-containing protein OS=Streptomyces bingchenggensis (strain BCW-1) OX=749414 GN=SBI_07503 PE=4 SV=1
MM1 pKa = 7.69SKK3 pKa = 9.0RR4 pKa = 11.84TFQPNNRR11 pKa = 11.84RR12 pKa = 11.84RR13 pKa = 11.84AKK15 pKa = 8.7THH17 pKa = 5.15GFRR20 pKa = 11.84LRR22 pKa = 11.84MRR24 pKa = 11.84TRR26 pKa = 11.84AGRR29 pKa = 11.84AILASRR35 pKa = 11.84RR36 pKa = 11.84SKK38 pKa = 11.06GRR40 pKa = 11.84GRR42 pKa = 11.84LSAA45 pKa = 4.4
MM1 pKa = 7.69SKK3 pKa = 9.0RR4 pKa = 11.84TFQPNNRR11 pKa = 11.84RR12 pKa = 11.84RR13 pKa = 11.84AKK15 pKa = 8.7THH17 pKa = 5.15GFRR20 pKa = 11.84LRR22 pKa = 11.84MRR24 pKa = 11.84TRR26 pKa = 11.84AGRR29 pKa = 11.84AILASRR35 pKa = 11.84RR36 pKa = 11.84SKK38 pKa = 11.06GRR40 pKa = 11.84GRR42 pKa = 11.84LSAA45 pKa = 4.4
Molecular weight: 5.27 kDa
Isoelectric point according different methods:
Peptides (in silico digests for buttom-up proteomics)
Below you can find in silico digests of the whole proteome with Trypsin, Chymotrypsin, Trypsin+LysC, LysN, ArgC proteases suitable for different mass spec machines.| Try ESI |
 |
|---|
| ChTry ESI |
 |
|---|
| ArgC ESI |
 |
|---|
| LysN ESI |
 |
|---|
| TryLysC ESI |
 |
|---|
| Try MALDI |
 |
|---|
| ChTry MALDI |
 |
|---|
| ArgC MALDI |
 |
|---|
| LysN MALDI |
 |
|---|
| TryLysC MALDI |
 |
|---|
| Try LTQ |
 |
|---|
| ChTry LTQ |
 |
|---|
| ArgC LTQ |
 |
|---|
| LysN LTQ |
 |
|---|
| TryLysC LTQ |
 |
|---|
| Try MSlow |
 |
|---|
| ChTry MSlow |
 |
|---|
| ArgC MSlow |
 |
|---|
| LysN MSlow |
 |
|---|
| TryLysC MSlow |
 |
|---|
| Try MShigh |
 |
|---|
| ChTry MShigh |
 |
|---|
| ArgC MShigh |
 |
|---|
| LysN MShigh |
 |
|---|
| TryLysC MShigh |
 |
|---|
General Statistics
Number of major isoforms |
Number of additional isoforms |
Number of all proteins |
Number of amino acids |
Min. Seq. Length |
Max. Seq. Length |
Avg. Seq. Length |
Avg. Mol. Weight |
|---|---|---|---|---|---|---|---|
0 |
3433066 |
24 |
9950 |
342.7 |
36.7 |
Amino acid frequency
Ala |
Cys |
Asp |
Glu |
Phe |
Gly |
His |
Ile |
Lys |
Leu |
|---|---|---|---|---|---|---|---|---|---|
13.686 ± 0.039 | 0.795 ± 0.007 |
6.029 ± 0.02 | 5.638 ± 0.023 |
2.711 ± 0.012 | 9.476 ± 0.025 |
2.371 ± 0.012 | 3.221 ± 0.017 |
2.078 ± 0.025 | 10.34 ± 0.032 |
Met |
Asn |
Gln |
Pro |
Arg |
Ser |
Thr |
Val |
Trp |
Tyr |
|---|---|---|---|---|---|---|---|---|---|
1.73 ± 0.009 | 1.764 ± 0.015 |
6.162 ± 0.024 | 2.8 ± 0.015 |
8.16 ± 0.028 | 5.124 ± 0.018 |
6.106 ± 0.022 | 8.155 ± 0.024 |
1.558 ± 0.01 | 2.097 ± 0.014 |
Most of the basic statistics you can see at this page can be downloaded from this CSV file
Proteome-pI is available under Creative Commons Attribution-NoDerivs license, for more details see here
| Reference: Kozlowski LP. Proteome-pI 2.0: Proteome Isoelectric Point Database Update. Nucleic Acids Res. 2021, doi: 10.1093/nar/gkab944 | Contact: Lukasz P. Kozlowski |
