Axonopus compressus streak virus
Taxonomy: Viruses; Monodnaviria; Shotokuvirae; Cressdnaviricota; Repensiviricetes; Geplafuvirales; Geminiviridae; Mastrevirus
Average proteome isoelectric point is 7.72
Get precalculated fractions of proteins
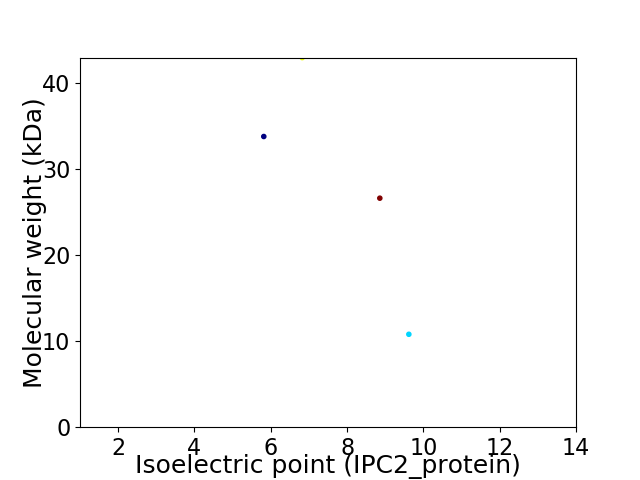
Virtual 2D-PAGE plot for 4 proteins (isoelectric point calculated using IPC2_protein)
Get csv file with sequences according to given criteria:
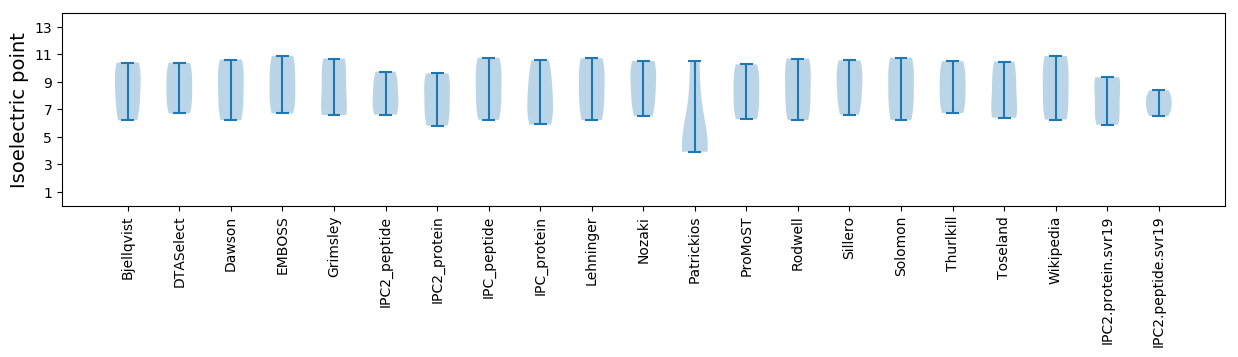
* You can choose from 21 different methods for calculating isoelectric point
Summary statistics related to proteome-wise predictions
Protein with the lowest isoelectric point:
>tr|X2F2A2|X2F2A2_9GEMI Replication-associated protein OS=Axonopus compressus streak virus OX=1476487 PE=3 SV=1
MM1 pKa = 7.53NNTEE5 pKa = 4.28HH6 pKa = 6.94GGPSGFRR13 pKa = 11.84FQSRR17 pKa = 11.84NIFLTYY23 pKa = 9.41PRR25 pKa = 11.84CNLAPEE31 pKa = 5.36LIGSFLLSLLSPYY44 pKa = 10.2HH45 pKa = 7.53VMFITVTSEE54 pKa = 3.51LHH56 pKa = 6.87KK57 pKa = 11.09DD58 pKa = 3.67GTPHH62 pKa = 5.92IHH64 pKa = 7.36ALAQTDD70 pKa = 3.9KK71 pKa = 10.75RR72 pKa = 11.84VHH74 pKa = 5.94TYY76 pKa = 10.51SPGFFDD82 pKa = 4.15VQGFHH87 pKa = 7.37PNIQSARR94 pKa = 11.84SPQTVLSYY102 pKa = 10.64ILKK105 pKa = 10.49SPTGTFNYY113 pKa = 10.34GSLRR117 pKa = 11.84PRR119 pKa = 11.84GTRR122 pKa = 11.84ADD124 pKa = 3.67AACGIGEE131 pKa = 4.13DD132 pKa = 4.03TAGGGASSSSSPPQADD148 pKa = 3.12QRR150 pKa = 11.84RR151 pKa = 11.84GSRR154 pKa = 11.84SRR156 pKa = 11.84EE157 pKa = 3.81LANDD161 pKa = 3.99PGRR164 pKa = 11.84DD165 pKa = 3.32RR166 pKa = 11.84KK167 pKa = 10.58DD168 pKa = 3.38VLMTSILAGSSSKK181 pKa = 10.78QEE183 pKa = 3.91FLNGVKK189 pKa = 10.2KK190 pKa = 10.69AFPYY194 pKa = 10.28DD195 pKa = 3.73FCARR199 pKa = 11.84LQNWEE204 pKa = 3.82YY205 pKa = 11.16AANKK209 pKa = 10.22LFDD212 pKa = 3.92TPAVYY217 pKa = 10.06QPPFPDD223 pKa = 3.91SYY225 pKa = 10.43FHH227 pKa = 6.21CHH229 pKa = 5.63EE230 pKa = 5.58NIHH233 pKa = 6.56DD234 pKa = 3.85WVRR237 pKa = 11.84DD238 pKa = 3.74NIYY241 pKa = 10.35EE242 pKa = 4.07ITPEE246 pKa = 4.32VYY248 pKa = 10.54SLLHH252 pKa = 6.7PYY254 pKa = 11.11ANAQEE259 pKa = 4.18DD260 pKa = 4.59LQWLHH265 pKa = 5.15NTVMNRR271 pKa = 11.84QDD273 pKa = 3.88PSPSTSVDD281 pKa = 3.15QQGQANQHH289 pKa = 5.8GPEE292 pKa = 4.08AWDD295 pKa = 3.42DD296 pKa = 3.79TTTGKK301 pKa = 10.33IMM303 pKa = 4.26
MM1 pKa = 7.53NNTEE5 pKa = 4.28HH6 pKa = 6.94GGPSGFRR13 pKa = 11.84FQSRR17 pKa = 11.84NIFLTYY23 pKa = 9.41PRR25 pKa = 11.84CNLAPEE31 pKa = 5.36LIGSFLLSLLSPYY44 pKa = 10.2HH45 pKa = 7.53VMFITVTSEE54 pKa = 3.51LHH56 pKa = 6.87KK57 pKa = 11.09DD58 pKa = 3.67GTPHH62 pKa = 5.92IHH64 pKa = 7.36ALAQTDD70 pKa = 3.9KK71 pKa = 10.75RR72 pKa = 11.84VHH74 pKa = 5.94TYY76 pKa = 10.51SPGFFDD82 pKa = 4.15VQGFHH87 pKa = 7.37PNIQSARR94 pKa = 11.84SPQTVLSYY102 pKa = 10.64ILKK105 pKa = 10.49SPTGTFNYY113 pKa = 10.34GSLRR117 pKa = 11.84PRR119 pKa = 11.84GTRR122 pKa = 11.84ADD124 pKa = 3.67AACGIGEE131 pKa = 4.13DD132 pKa = 4.03TAGGGASSSSSPPQADD148 pKa = 3.12QRR150 pKa = 11.84RR151 pKa = 11.84GSRR154 pKa = 11.84SRR156 pKa = 11.84EE157 pKa = 3.81LANDD161 pKa = 3.99PGRR164 pKa = 11.84DD165 pKa = 3.32RR166 pKa = 11.84KK167 pKa = 10.58DD168 pKa = 3.38VLMTSILAGSSSKK181 pKa = 10.78QEE183 pKa = 3.91FLNGVKK189 pKa = 10.2KK190 pKa = 10.69AFPYY194 pKa = 10.28DD195 pKa = 3.73FCARR199 pKa = 11.84LQNWEE204 pKa = 3.82YY205 pKa = 11.16AANKK209 pKa = 10.22LFDD212 pKa = 3.92TPAVYY217 pKa = 10.06QPPFPDD223 pKa = 3.91SYY225 pKa = 10.43FHH227 pKa = 6.21CHH229 pKa = 5.63EE230 pKa = 5.58NIHH233 pKa = 6.56DD234 pKa = 3.85WVRR237 pKa = 11.84DD238 pKa = 3.74NIYY241 pKa = 10.35EE242 pKa = 4.07ITPEE246 pKa = 4.32VYY248 pKa = 10.54SLLHH252 pKa = 6.7PYY254 pKa = 11.11ANAQEE259 pKa = 4.18DD260 pKa = 4.59LQWLHH265 pKa = 5.15NTVMNRR271 pKa = 11.84QDD273 pKa = 3.88PSPSTSVDD281 pKa = 3.15QQGQANQHH289 pKa = 5.8GPEE292 pKa = 4.08AWDD295 pKa = 3.42DD296 pKa = 3.79TTTGKK301 pKa = 10.33IMM303 pKa = 4.26
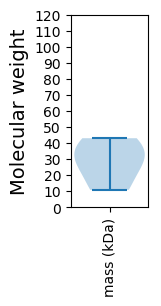
Molecular weight: 33.81 kDa
Isoelectric point according different methods:
Protein with the highest isoelectric point:
>tr|X2EZP9|X2EZP9_9GEMI Capsid protein OS=Axonopus compressus streak virus OX=1476487 PE=3 SV=1
MM1 pKa = 7.75FYY3 pKa = 10.76RR4 pKa = 11.84MEE6 pKa = 5.12RR7 pKa = 11.84GPLPQVSSVYY17 pKa = 10.53VLSPPAGPAPTTFVGNDD34 pKa = 3.68GAWRR38 pKa = 11.84FLVLLLACTALAGGTLFACWRR59 pKa = 11.84LLGKK63 pKa = 10.15DD64 pKa = 3.65LLLTLKK70 pKa = 10.3ARR72 pKa = 11.84RR73 pKa = 11.84SRR75 pKa = 11.84TVTEE79 pKa = 4.46LGFGQTPPGRR89 pKa = 11.84QAGAGSQPVGPFGG102 pKa = 3.99
MM1 pKa = 7.75FYY3 pKa = 10.76RR4 pKa = 11.84MEE6 pKa = 5.12RR7 pKa = 11.84GPLPQVSSVYY17 pKa = 10.53VLSPPAGPAPTTFVGNDD34 pKa = 3.68GAWRR38 pKa = 11.84FLVLLLACTALAGGTLFACWRR59 pKa = 11.84LLGKK63 pKa = 10.15DD64 pKa = 3.65LLLTLKK70 pKa = 10.3ARR72 pKa = 11.84RR73 pKa = 11.84SRR75 pKa = 11.84TVTEE79 pKa = 4.46LGFGQTPPGRR89 pKa = 11.84QAGAGSQPVGPFGG102 pKa = 3.99
Molecular weight: 10.81 kDa
Isoelectric point according different methods:
Peptides (in silico digests for buttom-up proteomics)
Below you can find in silico digests of the whole proteome with Trypsin, Chymotrypsin, Trypsin+LysC, LysN, ArgC proteases suitable for different mass spec machines.| Try ESI |
 |
|---|
| ChTry ESI |
|
|---|
| ArgC ESI |
|
|---|
| LysN ESI |
|
|---|
| TryLysC ESI |
|
|---|
| Try MALDI |
|
|---|
| ChTry MALDI |
|
|---|
| ArgC MALDI |
|
|---|
| LysN MALDI |
|
|---|
| TryLysC MALDI |
|
|---|
| Try LTQ |
|
|---|
| ChTry LTQ |
|
|---|
| ArgC LTQ |
|
|---|
| LysN LTQ |
|
|---|
| TryLysC LTQ |
|
|---|
| Try MSlow |
|
|---|
| ChTry MSlow |
|
|---|
| ArgC MSlow |
|
|---|
| LysN MSlow |
|
|---|
| TryLysC MSlow |
|
|---|
| Try MShigh |
|
|---|
| ChTry MShigh |
|
|---|
| ArgC MShigh |
|
|---|
| LysN MShigh |
|
|---|
| TryLysC MShigh |
|
|---|
General Statistics
Number of major isoforms |
Number of additional isoforms |
Number of all proteins |
Number of amino acids |
Min. Seq. Length |
Max. Seq. Length |
Avg. Seq. Length |
Avg. Mol. Weight |
|---|---|---|---|---|---|---|---|
0 |
1024 |
102 |
382 |
256.0 |
28.56 |
Amino acid frequency
Ala |
Cys |
Asp |
Glu |
Phe |
Gly |
His |
Ile |
Lys |
Leu |
|---|---|---|---|---|---|---|---|---|---|
6.836 ± 0.439 | 2.344 ± 0.496 |
5.957 ± 0.511 | 3.418 ± 0.464 |
4.785 ± 0.407 | 8.008 ± 0.727 |
2.93 ± 0.553 | 4.004 ± 0.691 |
3.906 ± 0.549 | 7.52 ± 0.941 |
Met |
Asn |
Gln |
Pro |
Arg |
Ser |
Thr |
Val |
Trp |
Tyr |
|---|---|---|---|---|---|---|---|---|---|
1.465 ± 0.114 | 4.492 ± 0.489 |
6.836 ± 0.633 | 3.906 ± 0.686 |
6.934 ± 0.854 | 8.301 ± 0.609 |
6.836 ± 0.545 | 5.664 ± 0.905 |
1.855 ± 0.333 | 4.004 ± 0.426 |
Most of the basic statistics you can see at this page can be downloaded from this CSV file
See this proteome in:

Proteome-pI is available under Creative Commons Attribution-NoDerivs license, for more details see here
| Reference: Kozlowski LP. Proteome-pI 2.0: Proteome Isoelectric Point Database Update. Nucleic Acids Res. 2021, doi: 10.1093/nar/gkab944 | Contact: Lukasz P. Kozlowski |