Holzapfelia floricola DSM 23037 = JCM 16512
Taxonomy: cellular organisms; Bacteria; Terrabacteria group; Firmicutes; Bacilli; Lactobacillales; Lactobacillaceae; Holzapfelia; Holzapfelia floricola
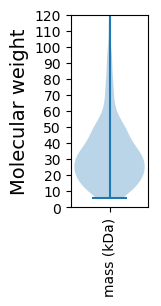
Average proteome isoelectric point is 6.56
Get precalculated fractions of proteins

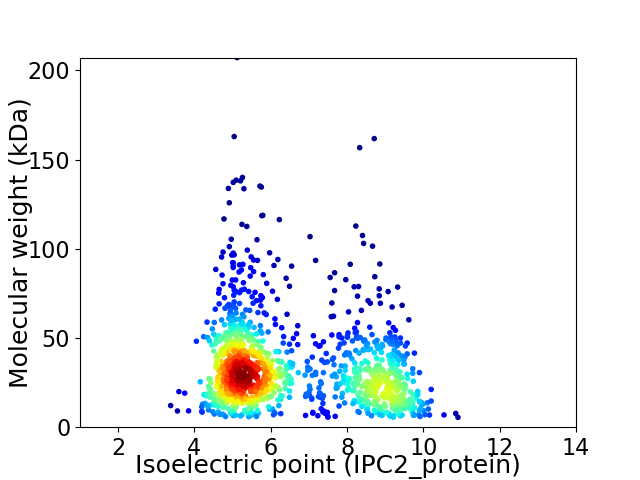
Virtual 2D-PAGE plot for 1222 proteins (isoelectric point calculated using IPC2_protein)
Get csv file with sequences according to given criteria:
* You can choose from 21 different methods for calculating isoelectric point
Summary statistics related to proteome-wise predictions


Protein with the lowest isoelectric point:
>tr|A0A0R2DK45|A0A0R2DK45_9LACO AlbA_2 domain-containing protein OS=Holzapfelia floricola DSM 23037 = JCM 16512 OX=1423744 GN=FC86_GL000584 PE=4 SV=1
MM1 pKa = 7.23NLSIPSYY8 pKa = 10.77FDD10 pKa = 3.2YY11 pKa = 10.85KK12 pKa = 11.02KK13 pKa = 11.02EE14 pKa = 4.11DD15 pKa = 3.57FTLTTAKK22 pKa = 9.67IVYY25 pKa = 10.68ASMTGNNEE33 pKa = 3.75EE34 pKa = 4.03VASIIDD40 pKa = 3.85EE41 pKa = 4.3KK42 pKa = 10.61LQDD45 pKa = 3.62MGIQTDD51 pKa = 3.43MSDD54 pKa = 2.81ITFSDD59 pKa = 3.55VNEE62 pKa = 3.86FSEE65 pKa = 4.28YY66 pKa = 10.69DD67 pKa = 3.19IAFMVPYY74 pKa = 10.13SYY76 pKa = 11.8GEE78 pKa = 4.23GEE80 pKa = 4.75LPDD83 pKa = 3.87EE84 pKa = 4.77ALDD87 pKa = 4.07FYY89 pKa = 11.61EE90 pKa = 5.78DD91 pKa = 3.97LLEE94 pKa = 6.05IDD96 pKa = 3.94LTDD99 pKa = 5.0KK100 pKa = 10.89IFAVAGSGDD109 pKa = 3.71VFYY112 pKa = 11.13EE113 pKa = 3.84DD114 pKa = 5.13AYY116 pKa = 11.11CITVDD121 pKa = 4.64DD122 pKa = 4.08FTKK125 pKa = 10.94AFLKK129 pKa = 10.62IGGIQAAEE137 pKa = 3.89SLKK140 pKa = 10.85INLAPDD146 pKa = 3.55LEE148 pKa = 5.93DD149 pKa = 4.08IEE151 pKa = 5.6NIEE154 pKa = 4.1QFTEE158 pKa = 4.05KK159 pKa = 10.62AVNFYY164 pKa = 9.93EE165 pKa = 4.5ANHH168 pKa = 6.32KK169 pKa = 10.08
MM1 pKa = 7.23NLSIPSYY8 pKa = 10.77FDD10 pKa = 3.2YY11 pKa = 10.85KK12 pKa = 11.02KK13 pKa = 11.02EE14 pKa = 4.11DD15 pKa = 3.57FTLTTAKK22 pKa = 9.67IVYY25 pKa = 10.68ASMTGNNEE33 pKa = 3.75EE34 pKa = 4.03VASIIDD40 pKa = 3.85EE41 pKa = 4.3KK42 pKa = 10.61LQDD45 pKa = 3.62MGIQTDD51 pKa = 3.43MSDD54 pKa = 2.81ITFSDD59 pKa = 3.55VNEE62 pKa = 3.86FSEE65 pKa = 4.28YY66 pKa = 10.69DD67 pKa = 3.19IAFMVPYY74 pKa = 10.13SYY76 pKa = 11.8GEE78 pKa = 4.23GEE80 pKa = 4.75LPDD83 pKa = 3.87EE84 pKa = 4.77ALDD87 pKa = 4.07FYY89 pKa = 11.61EE90 pKa = 5.78DD91 pKa = 3.97LLEE94 pKa = 6.05IDD96 pKa = 3.94LTDD99 pKa = 5.0KK100 pKa = 10.89IFAVAGSGDD109 pKa = 3.71VFYY112 pKa = 11.13EE113 pKa = 3.84DD114 pKa = 5.13AYY116 pKa = 11.11CITVDD121 pKa = 4.64DD122 pKa = 4.08FTKK125 pKa = 10.94AFLKK129 pKa = 10.62IGGIQAAEE137 pKa = 3.89SLKK140 pKa = 10.85INLAPDD146 pKa = 3.55LEE148 pKa = 5.93DD149 pKa = 4.08IEE151 pKa = 5.6NIEE154 pKa = 4.1QFTEE158 pKa = 4.05KK159 pKa = 10.62AVNFYY164 pKa = 9.93EE165 pKa = 4.5ANHH168 pKa = 6.32KK169 pKa = 10.08
Molecular weight: 19.1 kDa
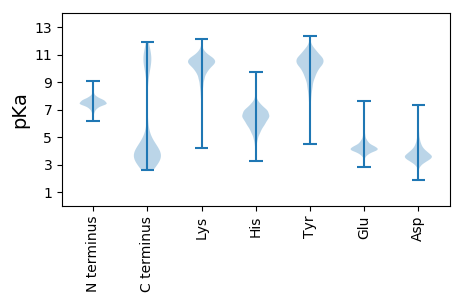
Isoelectric point according different methods:
Protein with the highest isoelectric point:
>tr|A0A0R2DTX9|A0A0R2DTX9_9LACO Phosphoribosylglycinamide formyltransferase OS=Holzapfelia floricola DSM 23037 = JCM 16512 OX=1423744 GN=purN PE=3 SV=1
MM1 pKa = 7.92PKK3 pKa = 10.12QKK5 pKa = 7.54THH7 pKa = 6.73RR8 pKa = 11.84GSAKK12 pKa = 10.13RR13 pKa = 11.84FKK15 pKa = 9.74KK16 pKa = 8.27TANGGLKK23 pKa = 9.49RR24 pKa = 11.84HH25 pKa = 6.15HH26 pKa = 7.23AFTGHH31 pKa = 6.77RR32 pKa = 11.84FHH34 pKa = 7.54GKK36 pKa = 6.24TKK38 pKa = 9.47KK39 pKa = 9.37QRR41 pKa = 11.84RR42 pKa = 11.84HH43 pKa = 4.7LRR45 pKa = 11.84KK46 pKa = 9.35SAMVSASDD54 pKa = 3.79FKK56 pKa = 10.9RR57 pKa = 11.84IKK59 pKa = 10.67QMLSQVRR66 pKa = 3.52
MM1 pKa = 7.92PKK3 pKa = 10.12QKK5 pKa = 7.54THH7 pKa = 6.73RR8 pKa = 11.84GSAKK12 pKa = 10.13RR13 pKa = 11.84FKK15 pKa = 9.74KK16 pKa = 8.27TANGGLKK23 pKa = 9.49RR24 pKa = 11.84HH25 pKa = 6.15HH26 pKa = 7.23AFTGHH31 pKa = 6.77RR32 pKa = 11.84FHH34 pKa = 7.54GKK36 pKa = 6.24TKK38 pKa = 9.47KK39 pKa = 9.37QRR41 pKa = 11.84RR42 pKa = 11.84HH43 pKa = 4.7LRR45 pKa = 11.84KK46 pKa = 9.35SAMVSASDD54 pKa = 3.79FKK56 pKa = 10.9RR57 pKa = 11.84IKK59 pKa = 10.67QMLSQVRR66 pKa = 3.52
Molecular weight: 7.74 kDa
Isoelectric point according different methods:
Peptides (in silico digests for buttom-up proteomics)
Below you can find in silico digests of the whole proteome with Trypsin, Chymotrypsin, Trypsin+LysC, LysN, ArgC proteases suitable for different mass spec machines.| Try ESI |
 |
|---|
| ChTry ESI |
 |
|---|
| ArgC ESI |
 |
|---|
| LysN ESI |
 |
|---|
| TryLysC ESI |
 |
|---|
| Try MALDI |
 |
|---|
| ChTry MALDI |
 |
|---|
| ArgC MALDI |
 |
|---|
| LysN MALDI |
 |
|---|
| TryLysC MALDI |
 |
|---|
| Try LTQ |
 |
|---|
| ChTry LTQ |
 |
|---|
| ArgC LTQ |
 |
|---|
| LysN LTQ |
 |
|---|
| TryLysC LTQ |
 |
|---|
| Try MSlow |
 |
|---|
| ChTry MSlow |
 |
|---|
| ArgC MSlow |
 |
|---|
| LysN MSlow |
 |
|---|
| TryLysC MSlow |
 |
|---|
| Try MShigh |
 |
|---|
| ChTry MShigh |
 |
|---|
| ArgC MShigh |
 |
|---|
| LysN MShigh |
 |
|---|
| TryLysC MShigh |
 |
|---|
General Statistics
Number of major isoforms |
Number of additional isoforms |
Number of all proteins |
Number of amino acids |
Min. Seq. Length |
Max. Seq. Length |
Avg. Seq. Length |
Avg. Mol. Weight |
|---|---|---|---|---|---|---|---|
0 |
383689 |
45 |
1884 |
314.0 |
35.28 |
Amino acid frequency
Ala |
Cys |
Asp |
Glu |
Phe |
Gly |
His |
Ile |
Lys |
Leu |
|---|---|---|---|---|---|---|---|---|---|
6.679 ± 0.067 | 0.374 ± 0.014 |
5.782 ± 0.061 | 6.114 ± 0.069 |
4.449 ± 0.058 | 6.049 ± 0.064 |
1.883 ± 0.033 | 7.765 ± 0.065 |
7.224 ± 0.058 | 9.886 ± 0.089 |
Met |
Asn |
Gln |
Pro |
Arg |
Ser |
Thr |
Val |
Trp |
Tyr |
|---|---|---|---|---|---|---|---|---|---|
2.509 ± 0.034 | 5.63 ± 0.082 |
3.259 ± 0.034 | 5.044 ± 0.067 |
3.556 ± 0.053 | 6.662 ± 0.063 |
5.864 ± 0.046 | 6.781 ± 0.061 |
0.732 ± 0.021 | 3.743 ± 0.048 |
Most of the basic statistics you can see at this page can be downloaded from this CSV file
Proteome-pI is available under Creative Commons Attribution-NoDerivs license, for more details see here
| Reference: Kozlowski LP. Proteome-pI 2.0: Proteome Isoelectric Point Database Update. Nucleic Acids Res. 2021, doi: 10.1093/nar/gkab944 | Contact: Lukasz P. Kozlowski |
