Nanosalina sp. (strain J07AB43)
Taxonomy: cellular organisms; Archaea; Euryarchaeota; Stenosarchaea group; Nanohaloarchaea; Candidatus Nanosalina; unclassified Candidatus Nanosalina
Average proteome isoelectric point is 5.22
Get precalculated fractions of proteins

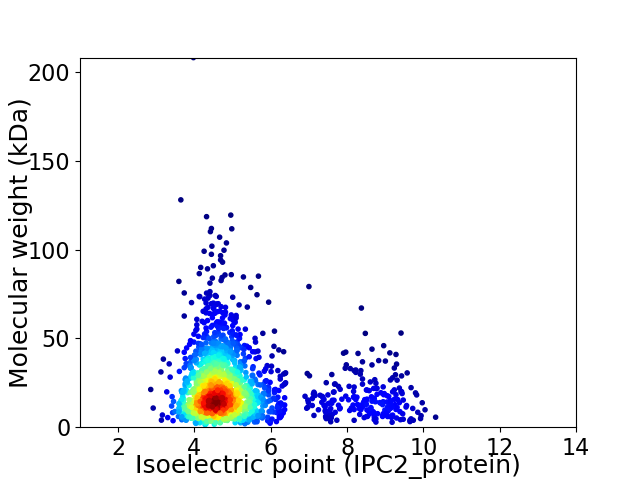
Virtual 2D-PAGE plot for 1673 proteins (isoelectric point calculated using IPC2_protein)
Get csv file with sequences according to given criteria:
* You can choose from 21 different methods for calculating isoelectric point
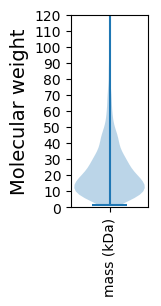
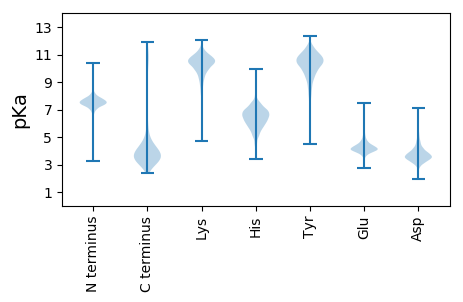
Summary statistics related to proteome-wise predictions


Protein with the lowest isoelectric point:
>tr|G0QI38|G0QI38_NANS0 Uncharacterized protein (Fragment) OS=Nanosalina sp. (strain J07AB43) OX=889948 GN=J07AB43_09070 PE=4 SV=1
VV1 pKa = 6.76FVVDD5 pKa = 4.06DD6 pKa = 4.89HH7 pKa = 6.45NHH9 pKa = 6.44ALAGWTAALYY19 pKa = 10.05EE20 pKa = 4.34GLFDD24 pKa = 3.93SRR26 pKa = 11.84PILVHH31 pKa = 6.48VDD33 pKa = 3.34YY34 pKa = 11.34HH35 pKa = 6.86EE36 pKa = 6.12DD37 pKa = 3.38SANPPEE43 pKa = 4.43VFNTNLPTDD52 pKa = 4.45FPTLEE57 pKa = 4.4DD58 pKa = 3.39QVHH61 pKa = 6.25LLEE64 pKa = 5.77IDD66 pKa = 3.57EE67 pKa = 5.22FIEE70 pKa = 4.68AGKK73 pKa = 8.55MWDD76 pKa = 3.82IYY78 pKa = 11.56DD79 pKa = 3.53EE80 pKa = 4.51VINVGVQSYY89 pKa = 10.81YY90 pKa = 11.22SDD92 pKa = 4.56LDD94 pKa = 3.31QDD96 pKa = 4.36LYY98 pKa = 11.55RR99 pKa = 11.84MKK101 pKa = 10.8EE102 pKa = 3.85AMQDD106 pKa = 3.33SDD108 pKa = 5.98DD109 pKa = 4.46VILDD113 pKa = 2.91IDD115 pKa = 3.81MYY117 pKa = 11.31VYY119 pKa = 10.95NRR121 pKa = 11.84DD122 pKa = 3.86DD123 pKa = 4.21LVDD126 pKa = 4.91DD127 pKa = 4.41FDD129 pKa = 5.88LRR131 pKa = 11.84LADD134 pKa = 4.06AVSEE138 pKa = 4.57SEE140 pKa = 4.19FTSFATSPGYY150 pKa = 10.58VQDD153 pKa = 3.55QEE155 pKa = 4.73EE156 pKa = 4.73IIEE159 pKa = 4.47KK160 pKa = 10.39INGIVEE166 pKa = 4.02MADD169 pKa = 3.4RR170 pKa = 11.84LL171 pKa = 3.88
VV1 pKa = 6.76FVVDD5 pKa = 4.06DD6 pKa = 4.89HH7 pKa = 6.45NHH9 pKa = 6.44ALAGWTAALYY19 pKa = 10.05EE20 pKa = 4.34GLFDD24 pKa = 3.93SRR26 pKa = 11.84PILVHH31 pKa = 6.48VDD33 pKa = 3.34YY34 pKa = 11.34HH35 pKa = 6.86EE36 pKa = 6.12DD37 pKa = 3.38SANPPEE43 pKa = 4.43VFNTNLPTDD52 pKa = 4.45FPTLEE57 pKa = 4.4DD58 pKa = 3.39QVHH61 pKa = 6.25LLEE64 pKa = 5.77IDD66 pKa = 3.57EE67 pKa = 5.22FIEE70 pKa = 4.68AGKK73 pKa = 8.55MWDD76 pKa = 3.82IYY78 pKa = 11.56DD79 pKa = 3.53EE80 pKa = 4.51VINVGVQSYY89 pKa = 10.81YY90 pKa = 11.22SDD92 pKa = 4.56LDD94 pKa = 3.31QDD96 pKa = 4.36LYY98 pKa = 11.55RR99 pKa = 11.84MKK101 pKa = 10.8EE102 pKa = 3.85AMQDD106 pKa = 3.33SDD108 pKa = 5.98DD109 pKa = 4.46VILDD113 pKa = 2.91IDD115 pKa = 3.81MYY117 pKa = 11.31VYY119 pKa = 10.95NRR121 pKa = 11.84DD122 pKa = 3.86DD123 pKa = 4.21LVDD126 pKa = 4.91DD127 pKa = 4.41FDD129 pKa = 5.88LRR131 pKa = 11.84LADD134 pKa = 4.06AVSEE138 pKa = 4.57SEE140 pKa = 4.19FTSFATSPGYY150 pKa = 10.58VQDD153 pKa = 3.55QEE155 pKa = 4.73EE156 pKa = 4.73IIEE159 pKa = 4.47KK160 pKa = 10.39INGIVEE166 pKa = 4.02MADD169 pKa = 3.4RR170 pKa = 11.84LL171 pKa = 3.88
Molecular weight: 19.67 kDa
Isoelectric point according different methods:
Protein with the highest isoelectric point:
>tr|G0QHM9|G0QHM9_NANS0 Mn-dependent transcriptional regulator OS=Nanosalina sp. (strain J07AB43) OX=889948 GN=J07AB43_07470 PE=4 SV=1
MM1 pKa = 7.76EE2 pKa = 4.87SFCFFTEE9 pKa = 3.83KK10 pKa = 10.34MKK12 pKa = 10.22DD13 pKa = 2.82TGRR16 pKa = 11.84YY17 pKa = 8.71LVAKK21 pKa = 9.52LRR23 pKa = 11.84KK24 pKa = 8.95RR25 pKa = 11.84SRR27 pKa = 11.84LHH29 pKa = 5.32RR30 pKa = 11.84QLYY33 pKa = 7.67VKK35 pKa = 9.88PVKK38 pKa = 10.41RR39 pKa = 3.78
MM1 pKa = 7.76EE2 pKa = 4.87SFCFFTEE9 pKa = 3.83KK10 pKa = 10.34MKK12 pKa = 10.22DD13 pKa = 2.82TGRR16 pKa = 11.84YY17 pKa = 8.71LVAKK21 pKa = 9.52LRR23 pKa = 11.84KK24 pKa = 8.95RR25 pKa = 11.84SRR27 pKa = 11.84LHH29 pKa = 5.32RR30 pKa = 11.84QLYY33 pKa = 7.67VKK35 pKa = 9.88PVKK38 pKa = 10.41RR39 pKa = 3.78
Molecular weight: 4.85 kDa
Isoelectric point according different methods:
Peptides (in silico digests for buttom-up proteomics)
Below you can find in silico digests of the whole proteome with Trypsin, Chymotrypsin, Trypsin+LysC, LysN, ArgC proteases suitable for different mass spec machines.| Try ESI |
 |
|---|
| ChTry ESI |
 |
|---|
| ArgC ESI |
 |
|---|
| LysN ESI |
 |
|---|
| TryLysC ESI |
 |
|---|
| Try MALDI |
 |
|---|
| ChTry MALDI |
 |
|---|
| ArgC MALDI |
 |
|---|
| LysN MALDI |
 |
|---|
| TryLysC MALDI |
 |
|---|
| Try LTQ |
 |
|---|
| ChTry LTQ |
 |
|---|
| ArgC LTQ |
 |
|---|
| LysN LTQ |
 |
|---|
| TryLysC LTQ |
 |
|---|
| Try MSlow |
 |
|---|
| ChTry MSlow |
 |
|---|
| ArgC MSlow |
 |
|---|
| LysN MSlow |
 |
|---|
| TryLysC MSlow |
 |
|---|
| Try MShigh |
 |
|---|
| ChTry MShigh |
 |
|---|
| ArgC MShigh |
 |
|---|
| LysN MShigh |
 |
|---|
| TryLysC MShigh |
 |
|---|
General Statistics
Number of major isoforms |
Number of additional isoforms |
Number of all proteins |
Number of amino acids |
Min. Seq. Length |
Max. Seq. Length |
Avg. Seq. Length |
Avg. Mol. Weight |
|---|---|---|---|---|---|---|---|
0 |
354589 |
13 |
1924 |
211.9 |
23.79 |
Amino acid frequency
Ala |
Cys |
Asp |
Glu |
Phe |
Gly |
His |
Ile |
Lys |
Leu |
|---|---|---|---|---|---|---|---|---|---|
5.905 ± 0.057 | 0.673 ± 0.021 |
7.402 ± 0.064 | 10.251 ± 0.119 |
3.859 ± 0.042 | 6.922 ± 0.07 |
1.699 ± 0.036 | 6.232 ± 0.057 |
5.825 ± 0.075 | 8.211 ± 0.081 |
Met |
Asn |
Gln |
Pro |
Arg |
Ser |
Thr |
Val |
Trp |
Tyr |
|---|---|---|---|---|---|---|---|---|---|
2.406 ± 0.029 | 4.623 ± 0.054 |
3.437 ± 0.04 | 3.755 ± 0.049 |
4.838 ± 0.049 | 7.554 ± 0.082 |
5.233 ± 0.052 | 6.897 ± 0.061 |
0.858 ± 0.021 | 3.257 ± 0.035 |
Most of the basic statistics you can see at this page can be downloaded from this CSV file
Proteome-pI is available under Creative Commons Attribution-NoDerivs license, for more details see here
| Reference: Kozlowski LP. Proteome-pI 2.0: Proteome Isoelectric Point Database Update. Nucleic Acids Res. 2021, doi: 10.1093/nar/gkab944 | Contact: Lukasz P. Kozlowski |
