Kudzu mosaic virus
Taxonomy: Viruses; Monodnaviria; Shotokuvirae; Cressdnaviricota; Repensiviricetes; Geplafuvirales; Geminiviridae; Begomovirus
Average proteome isoelectric point is 8.18
Get precalculated fractions of proteins

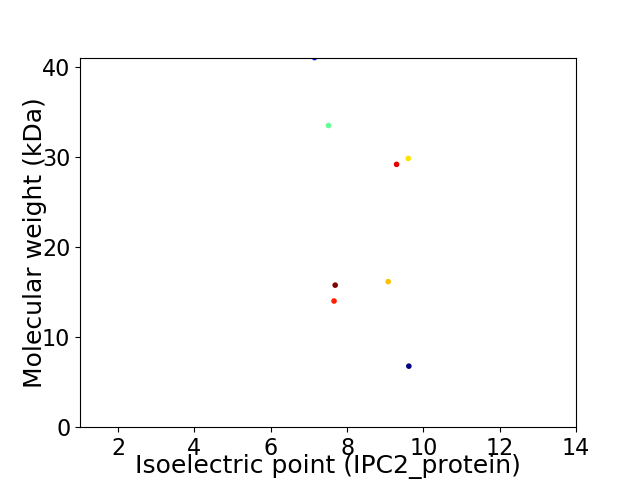
Virtual 2D-PAGE plot for 8 proteins (isoelectric point calculated using IPC2_protein)
Get csv file with sequences according to given criteria:
* You can choose from 21 different methods for calculating isoelectric point
Summary statistics related to proteome-wise predictions


Protein with the lowest isoelectric point:
>tr|A5H149|A5H149_9GEMI AC4 protein OS=Kudzu mosaic virus OX=390437 GN=AC4 PE=3 SV=1
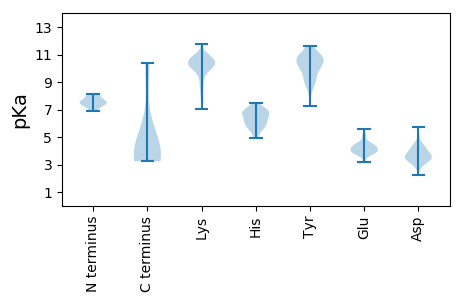
MM1 pKa = 7.39SRR3 pKa = 11.84PKK5 pKa = 10.63GFRR8 pKa = 11.84VNAKK12 pKa = 10.02NFFLTYY18 pKa = 9.42PRR20 pKa = 11.84CSLSKK25 pKa = 10.39EE26 pKa = 3.81AALEE30 pKa = 3.79QLQNIQTNVNKK41 pKa = 10.41KK42 pKa = 9.79FIRR45 pKa = 11.84VCRR48 pKa = 11.84EE49 pKa = 3.17FHH51 pKa = 7.08EE52 pKa = 4.54NGEE55 pKa = 4.19PHH57 pKa = 6.75LHH59 pKa = 6.18VLLQFEE65 pKa = 5.55GKK67 pKa = 8.94FQCRR71 pKa = 11.84NEE73 pKa = 3.98RR74 pKa = 11.84FFDD77 pKa = 3.88LVSEE81 pKa = 4.27TRR83 pKa = 11.84SAHH86 pKa = 4.92FHH88 pKa = 6.58PNIQGAKK95 pKa = 9.58SSSDD99 pKa = 3.05VKK101 pKa = 11.03KK102 pKa = 11.15YY103 pKa = 8.81MEE105 pKa = 5.11KK106 pKa = 10.77DD107 pKa = 2.85GDD109 pKa = 4.05VIDD112 pKa = 5.28FGIFQIDD119 pKa = 3.36GRR121 pKa = 11.84SNRR124 pKa = 11.84GGSQCANDD132 pKa = 4.53AYY134 pKa = 10.9AEE136 pKa = 4.79AINSGDD142 pKa = 3.38TTSALNILKK151 pKa = 10.08EE152 pKa = 3.89KK153 pKa = 10.38ASRR156 pKa = 11.84DD157 pKa = 4.27FIIHH161 pKa = 6.14LHH163 pKa = 6.23NIRR166 pKa = 11.84ANLNFLFAPPPTVYY180 pKa = 7.57EE181 pKa = 4.36TPFSIEE187 pKa = 3.81SFNNVPEE194 pKa = 4.43TLTSWAAEE202 pKa = 3.84NVVCPAARR210 pKa = 11.84PFRR213 pKa = 11.84PISIVVEE220 pKa = 4.42GEE222 pKa = 3.93SRR224 pKa = 11.84TGKK227 pKa = 8.58TMWARR232 pKa = 11.84SLGRR236 pKa = 11.84HH237 pKa = 5.8NYY239 pKa = 10.07LCGHH243 pKa = 7.45LDD245 pKa = 3.94LSAKK249 pKa = 10.22VYY251 pKa = 11.33SNDD254 pKa = 2.23AWYY257 pKa = 10.92NVIDD261 pKa = 5.2DD262 pKa = 4.41VDD264 pKa = 3.61PHH266 pKa = 5.85YY267 pKa = 11.0LKK269 pKa = 10.7HH270 pKa = 6.2FKK272 pKa = 10.76EE273 pKa = 4.49FMGAQKK279 pKa = 10.61DD280 pKa = 3.51WQSNVKK286 pKa = 9.81YY287 pKa = 10.5GKK289 pKa = 7.69PTQIKK294 pKa = 10.11GGIPTIFLCNAGPRR308 pKa = 11.84SSYY311 pKa = 11.61KK312 pKa = 9.97MFLDD316 pKa = 3.75EE317 pKa = 5.3EE318 pKa = 4.62NNASLKK324 pKa = 10.19EE325 pKa = 3.99WALKK329 pKa = 10.25NAIFYY334 pKa = 8.9TLTEE338 pKa = 4.36PLFSTTNQGATQVGQEE354 pKa = 4.44TCNSTQTNN362 pKa = 3.46
MM1 pKa = 7.39SRR3 pKa = 11.84PKK5 pKa = 10.63GFRR8 pKa = 11.84VNAKK12 pKa = 10.02NFFLTYY18 pKa = 9.42PRR20 pKa = 11.84CSLSKK25 pKa = 10.39EE26 pKa = 3.81AALEE30 pKa = 3.79QLQNIQTNVNKK41 pKa = 10.41KK42 pKa = 9.79FIRR45 pKa = 11.84VCRR48 pKa = 11.84EE49 pKa = 3.17FHH51 pKa = 7.08EE52 pKa = 4.54NGEE55 pKa = 4.19PHH57 pKa = 6.75LHH59 pKa = 6.18VLLQFEE65 pKa = 5.55GKK67 pKa = 8.94FQCRR71 pKa = 11.84NEE73 pKa = 3.98RR74 pKa = 11.84FFDD77 pKa = 3.88LVSEE81 pKa = 4.27TRR83 pKa = 11.84SAHH86 pKa = 4.92FHH88 pKa = 6.58PNIQGAKK95 pKa = 9.58SSSDD99 pKa = 3.05VKK101 pKa = 11.03KK102 pKa = 11.15YY103 pKa = 8.81MEE105 pKa = 5.11KK106 pKa = 10.77DD107 pKa = 2.85GDD109 pKa = 4.05VIDD112 pKa = 5.28FGIFQIDD119 pKa = 3.36GRR121 pKa = 11.84SNRR124 pKa = 11.84GGSQCANDD132 pKa = 4.53AYY134 pKa = 10.9AEE136 pKa = 4.79AINSGDD142 pKa = 3.38TTSALNILKK151 pKa = 10.08EE152 pKa = 3.89KK153 pKa = 10.38ASRR156 pKa = 11.84DD157 pKa = 4.27FIIHH161 pKa = 6.14LHH163 pKa = 6.23NIRR166 pKa = 11.84ANLNFLFAPPPTVYY180 pKa = 7.57EE181 pKa = 4.36TPFSIEE187 pKa = 3.81SFNNVPEE194 pKa = 4.43TLTSWAAEE202 pKa = 3.84NVVCPAARR210 pKa = 11.84PFRR213 pKa = 11.84PISIVVEE220 pKa = 4.42GEE222 pKa = 3.93SRR224 pKa = 11.84TGKK227 pKa = 8.58TMWARR232 pKa = 11.84SLGRR236 pKa = 11.84HH237 pKa = 5.8NYY239 pKa = 10.07LCGHH243 pKa = 7.45LDD245 pKa = 3.94LSAKK249 pKa = 10.22VYY251 pKa = 11.33SNDD254 pKa = 2.23AWYY257 pKa = 10.92NVIDD261 pKa = 5.2DD262 pKa = 4.41VDD264 pKa = 3.61PHH266 pKa = 5.85YY267 pKa = 11.0LKK269 pKa = 10.7HH270 pKa = 6.2FKK272 pKa = 10.76EE273 pKa = 4.49FMGAQKK279 pKa = 10.61DD280 pKa = 3.51WQSNVKK286 pKa = 9.81YY287 pKa = 10.5GKK289 pKa = 7.69PTQIKK294 pKa = 10.11GGIPTIFLCNAGPRR308 pKa = 11.84SSYY311 pKa = 11.61KK312 pKa = 9.97MFLDD316 pKa = 3.75EE317 pKa = 5.3EE318 pKa = 4.62NNASLKK324 pKa = 10.19EE325 pKa = 3.99WALKK329 pKa = 10.25NAIFYY334 pKa = 8.9TLTEE338 pKa = 4.36PLFSTTNQGATQVGQEE354 pKa = 4.44TCNSTQTNN362 pKa = 3.46
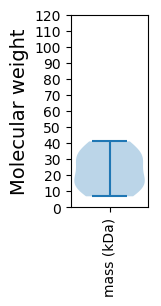
Molecular weight: 41.0 kDa
Isoelectric point according different methods:
Protein with the highest isoelectric point:
>tr|A5H150|A5H150_9GEMI Protein V2 OS=Kudzu mosaic virus OX=390437 GN=AV2 PE=3 SV=1
MM1 pKa = 7.62KK2 pKa = 9.84MGNLTSMFCFNLKK15 pKa = 9.94EE16 pKa = 4.03NSSAATKK23 pKa = 10.4GSSTSYY29 pKa = 9.88PKK31 pKa = 10.2PGQHH35 pKa = 5.64ISIRR39 pKa = 11.84TFRR42 pKa = 11.84EE43 pKa = 3.29LRR45 pKa = 11.84AAQMLKK51 pKa = 8.92STWRR55 pKa = 11.84KK56 pKa = 7.82TEE58 pKa = 3.72TSS60 pKa = 3.23
MM1 pKa = 7.62KK2 pKa = 9.84MGNLTSMFCFNLKK15 pKa = 9.94EE16 pKa = 4.03NSSAATKK23 pKa = 10.4GSSTSYY29 pKa = 9.88PKK31 pKa = 10.2PGQHH35 pKa = 5.64ISIRR39 pKa = 11.84TFRR42 pKa = 11.84EE43 pKa = 3.29LRR45 pKa = 11.84AAQMLKK51 pKa = 8.92STWRR55 pKa = 11.84KK56 pKa = 7.82TEE58 pKa = 3.72TSS60 pKa = 3.23
Molecular weight: 6.77 kDa
Isoelectric point according different methods:
Peptides (in silico digests for buttom-up proteomics)
Below you can find in silico digests of the whole proteome with Trypsin, Chymotrypsin, Trypsin+LysC, LysN, ArgC proteases suitable for different mass spec machines.| Try ESI |
 |
|---|
| ChTry ESI |
 |
|---|
| ArgC ESI |
 |
|---|
| LysN ESI |
 |
|---|
| TryLysC ESI |
 |
|---|
| Try MALDI |
 |
|---|
| ChTry MALDI |
 |
|---|
| ArgC MALDI |
 |
|---|
| LysN MALDI |
 |
|---|
| TryLysC MALDI |
 |
|---|
| Try LTQ |
 |
|---|
| ChTry LTQ |
 |
|---|
| ArgC LTQ |
 |
|---|
| LysN LTQ |
 |
|---|
| TryLysC LTQ |
 |
|---|
| Try MSlow |
 |
|---|
| ChTry MSlow |
 |
|---|
| ArgC MSlow |
 |
|---|
| LysN MSlow |
 |
|---|
| TryLysC MSlow |
 |
|---|
| Try MShigh |
 |
|---|
| ChTry MShigh |
 |
|---|
| ArgC MShigh |
 |
|---|
| LysN MShigh |
 |
|---|
| TryLysC MShigh |
 |
|---|
General Statistics
Number of major isoforms |
Number of additional isoforms |
Number of all proteins |
Number of amino acids |
Min. Seq. Length |
Max. Seq. Length |
Avg. Seq. Length |
Avg. Mol. Weight |
|---|---|---|---|---|---|---|---|
0 |
1635 |
60 |
362 |
204.4 |
23.27 |
Amino acid frequency
Ala |
Cys |
Asp |
Glu |
Phe |
Gly |
His |
Ile |
Lys |
Leu |
|---|---|---|---|---|---|---|---|---|---|
5.872 ± 0.415 | 2.263 ± 0.263 |
4.893 ± 0.435 | 4.343 ± 0.599 |
4.709 ± 0.573 | 5.505 ± 0.556 |
3.425 ± 0.559 | 4.893 ± 0.553 |
6.055 ± 0.256 | 8.196 ± 0.807 |
Met |
Asn |
Gln |
Pro |
Arg |
Ser |
Thr |
Val |
Trp |
Tyr |
|---|---|---|---|---|---|---|---|---|---|
2.324 ± 0.297 | 5.627 ± 0.646 |
5.749 ± 0.655 | 3.609 ± 0.321 |
6.972 ± 0.806 | 8.257 ± 0.541 |
6.055 ± 0.821 | 6.055 ± 0.592 |
1.284 ± 0.196 | 3.914 ± 0.475 |
Most of the basic statistics you can see at this page can be downloaded from this CSV file
Proteome-pI is available under Creative Commons Attribution-NoDerivs license, for more details see here
| Reference: Kozlowski LP. Proteome-pI 2.0: Proteome Isoelectric Point Database Update. Nucleic Acids Res. 2021, doi: 10.1093/nar/gkab944 | Contact: Lukasz P. Kozlowski |
