Thioalkalivibrio sulfidiphilus (strain HL-EbGR7)
Taxonomy: cellular organisms; Bacteria; Proteobacteria; Gammaproteobacteria; Chromatiales; Ectothiorhodospiraceae; Thioalkalivibrio; Thioalkalivibrio sulfidiphilus
Average proteome isoelectric point is 6.3
Get precalculated fractions of proteins

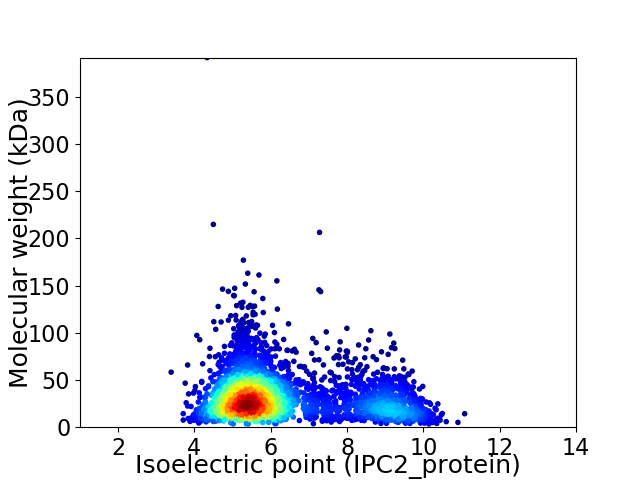
Virtual 2D-PAGE plot for 3272 proteins (isoelectric point calculated using IPC2_protein)
Get csv file with sequences according to given criteria:
* You can choose from 21 different methods for calculating isoelectric point
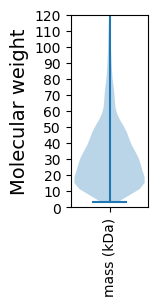
Summary statistics related to proteome-wise predictions


Protein with the lowest isoelectric point:
>tr|B8GM80|B8GM80_THISH Uncharacterized protein OS=Thioalkalivibrio sulfidiphilus (strain HL-EbGR7) OX=396588 GN=Tgr7_2592 PE=4 SV=1
MM1 pKa = 7.58GFPIRR6 pKa = 11.84SLSALALCLGVLLLQSGCGGGGGDD30 pKa = 5.63DD31 pKa = 4.31EE32 pKa = 5.37PPLPSGGWVTITSPTTDD49 pKa = 3.34PSFTDD54 pKa = 3.76YY55 pKa = 11.43CNEE58 pKa = 3.71AYY60 pKa = 10.76LFGEE64 pKa = 4.58AFISPDD70 pKa = 2.67WSAVGFDD77 pKa = 3.61GSVITGVTVTWYY89 pKa = 10.56NAATGQSGPATQSASICYY107 pKa = 9.91ILGTPVPCNHH117 pKa = 5.52VWWATVPMEE126 pKa = 4.38VGFNEE131 pKa = 3.74IRR133 pKa = 11.84ITATDD138 pKa = 3.66PDD140 pKa = 4.44GRR142 pKa = 11.84TGTDD146 pKa = 3.01TLTIDD151 pKa = 3.15HH152 pKa = 7.54PEE154 pKa = 3.9RR155 pKa = 11.84SFSLSGTVKK164 pKa = 9.1TDD166 pKa = 2.98AGIGLSFRR174 pKa = 11.84EE175 pKa = 4.08SQIDD179 pKa = 4.49LILSDD184 pKa = 3.77GSTTRR189 pKa = 11.84RR190 pKa = 11.84TVTSLDD196 pKa = 2.86GSYY199 pKa = 10.34RR200 pKa = 11.84FSCARR205 pKa = 11.84SNMGYY210 pKa = 8.61TITPSSPIPYY220 pKa = 9.72DD221 pKa = 3.45FTPEE225 pKa = 3.94EE226 pKa = 4.06QTVIPQGADD235 pKa = 3.1VSDD238 pKa = 4.73LDD240 pKa = 4.17FSTPAWFLSGLVQLEE255 pKa = 4.31SGGVLSGMMVNVSDD269 pKa = 5.71ASDD272 pKa = 3.37TDD274 pKa = 3.68VTQFTDD280 pKa = 2.94NTGAYY285 pKa = 9.82RR286 pKa = 11.84LALPNGSYY294 pKa = 9.33TVLARR299 pKa = 11.84DD300 pKa = 2.75IWNYY304 pKa = 10.38FSLSPDD310 pKa = 2.62GWTGPVVINGADD322 pKa = 3.32VADD325 pKa = 3.76QNFLATHH332 pKa = 6.79PP333 pKa = 4.15
MM1 pKa = 7.58GFPIRR6 pKa = 11.84SLSALALCLGVLLLQSGCGGGGGDD30 pKa = 5.63DD31 pKa = 4.31EE32 pKa = 5.37PPLPSGGWVTITSPTTDD49 pKa = 3.34PSFTDD54 pKa = 3.76YY55 pKa = 11.43CNEE58 pKa = 3.71AYY60 pKa = 10.76LFGEE64 pKa = 4.58AFISPDD70 pKa = 2.67WSAVGFDD77 pKa = 3.61GSVITGVTVTWYY89 pKa = 10.56NAATGQSGPATQSASICYY107 pKa = 9.91ILGTPVPCNHH117 pKa = 5.52VWWATVPMEE126 pKa = 4.38VGFNEE131 pKa = 3.74IRR133 pKa = 11.84ITATDD138 pKa = 3.66PDD140 pKa = 4.44GRR142 pKa = 11.84TGTDD146 pKa = 3.01TLTIDD151 pKa = 3.15HH152 pKa = 7.54PEE154 pKa = 3.9RR155 pKa = 11.84SFSLSGTVKK164 pKa = 9.1TDD166 pKa = 2.98AGIGLSFRR174 pKa = 11.84EE175 pKa = 4.08SQIDD179 pKa = 4.49LILSDD184 pKa = 3.77GSTTRR189 pKa = 11.84RR190 pKa = 11.84TVTSLDD196 pKa = 2.86GSYY199 pKa = 10.34RR200 pKa = 11.84FSCARR205 pKa = 11.84SNMGYY210 pKa = 8.61TITPSSPIPYY220 pKa = 9.72DD221 pKa = 3.45FTPEE225 pKa = 3.94EE226 pKa = 4.06QTVIPQGADD235 pKa = 3.1VSDD238 pKa = 4.73LDD240 pKa = 4.17FSTPAWFLSGLVQLEE255 pKa = 4.31SGGVLSGMMVNVSDD269 pKa = 5.71ASDD272 pKa = 3.37TDD274 pKa = 3.68VTQFTDD280 pKa = 2.94NTGAYY285 pKa = 9.82RR286 pKa = 11.84LALPNGSYY294 pKa = 9.33TVLARR299 pKa = 11.84DD300 pKa = 2.75IWNYY304 pKa = 10.38FSLSPDD310 pKa = 2.62GWTGPVVINGADD322 pKa = 3.32VADD325 pKa = 3.76QNFLATHH332 pKa = 6.79PP333 pKa = 4.15
Molecular weight: 35.26 kDa
Isoelectric point according different methods:
Protein with the highest isoelectric point:
>tr|B8GRK4|B8GRK4_THISH Glyoxalase/bleomycin resistance protein/dioxygenase OS=Thioalkalivibrio sulfidiphilus (strain HL-EbGR7) OX=396588 GN=Tgr7_1474 PE=4 SV=1
MM1 pKa = 7.45KK2 pKa = 9.56RR3 pKa = 11.84TFQPSTLKK11 pKa = 10.5RR12 pKa = 11.84KK13 pKa = 7.79RR14 pKa = 11.84THH16 pKa = 5.93GFRR19 pKa = 11.84ARR21 pKa = 11.84MATRR25 pKa = 11.84GGRR28 pKa = 11.84KK29 pKa = 8.89VLAARR34 pKa = 11.84RR35 pKa = 11.84AKK37 pKa = 10.54GRR39 pKa = 11.84VRR41 pKa = 11.84LCPP44 pKa = 3.58
MM1 pKa = 7.45KK2 pKa = 9.56RR3 pKa = 11.84TFQPSTLKK11 pKa = 10.5RR12 pKa = 11.84KK13 pKa = 7.79RR14 pKa = 11.84THH16 pKa = 5.93GFRR19 pKa = 11.84ARR21 pKa = 11.84MATRR25 pKa = 11.84GGRR28 pKa = 11.84KK29 pKa = 8.89VLAARR34 pKa = 11.84RR35 pKa = 11.84AKK37 pKa = 10.54GRR39 pKa = 11.84VRR41 pKa = 11.84LCPP44 pKa = 3.58
Molecular weight: 5.11 kDa
Isoelectric point according different methods:
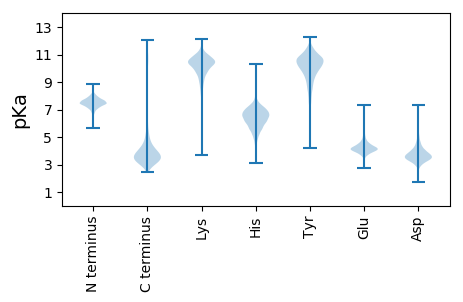
Peptides (in silico digests for buttom-up proteomics)
Below you can find in silico digests of the whole proteome with Trypsin, Chymotrypsin, Trypsin+LysC, LysN, ArgC proteases suitable for different mass spec machines.| Try ESI |
 |
|---|
| ChTry ESI |
 |
|---|
| ArgC ESI |
 |
|---|
| LysN ESI |
 |
|---|
| TryLysC ESI |
 |
|---|
| Try MALDI |
 |
|---|
| ChTry MALDI |
 |
|---|
| ArgC MALDI |
 |
|---|
| LysN MALDI |
 |
|---|
| TryLysC MALDI |
 |
|---|
| Try LTQ |
 |
|---|
| ChTry LTQ |
 |
|---|
| ArgC LTQ |
 |
|---|
| LysN LTQ |
 |
|---|
| TryLysC LTQ |
 |
|---|
| Try MSlow |
 |
|---|
| ChTry MSlow |
 |
|---|
| ArgC MSlow |
 |
|---|
| LysN MSlow |
 |
|---|
| TryLysC MSlow |
 |
|---|
| Try MShigh |
 |
|---|
| ChTry MShigh |
 |
|---|
| ArgC MShigh |
 |
|---|
| LysN MShigh |
 |
|---|
| TryLysC MShigh |
 |
|---|
General Statistics
Number of major isoforms |
Number of additional isoforms |
Number of all proteins |
Number of amino acids |
Min. Seq. Length |
Max. Seq. Length |
Avg. Seq. Length |
Avg. Mol. Weight |
|---|---|---|---|---|---|---|---|
0 |
1002246 |
31 |
3954 |
306.3 |
33.73 |
Amino acid frequency
Ala |
Cys |
Asp |
Glu |
Phe |
Gly |
His |
Ile |
Lys |
Leu |
|---|---|---|---|---|---|---|---|---|---|
10.984 ± 0.057 | 0.879 ± 0.016 |
5.703 ± 0.032 | 6.619 ± 0.045 |
3.381 ± 0.028 | 8.285 ± 0.05 |
2.516 ± 0.021 | 4.637 ± 0.033 |
2.672 ± 0.038 | 11.258 ± 0.055 |
Met |
Asn |
Gln |
Pro |
Arg |
Ser |
Thr |
Val |
Trp |
Tyr |
|---|---|---|---|---|---|---|---|---|---|
2.535 ± 0.024 | 2.528 ± 0.022 |
5.114 ± 0.032 | 3.699 ± 0.026 |
8.034 ± 0.044 | 5.008 ± 0.029 |
4.814 ± 0.028 | 7.555 ± 0.035 |
1.382 ± 0.021 | 2.4 ± 0.02 |
Most of the basic statistics you can see at this page can be downloaded from this CSV file
Proteome-pI is available under Creative Commons Attribution-NoDerivs license, for more details see here
| Reference: Kozlowski LP. Proteome-pI 2.0: Proteome Isoelectric Point Database Update. Nucleic Acids Res. 2021, doi: 10.1093/nar/gkab944 | Contact: Lukasz P. Kozlowski |
