Megamonas hypermegale
Taxonomy: cellular organisms;
Average proteome isoelectric point is 6.56
Get precalculated fractions of proteins

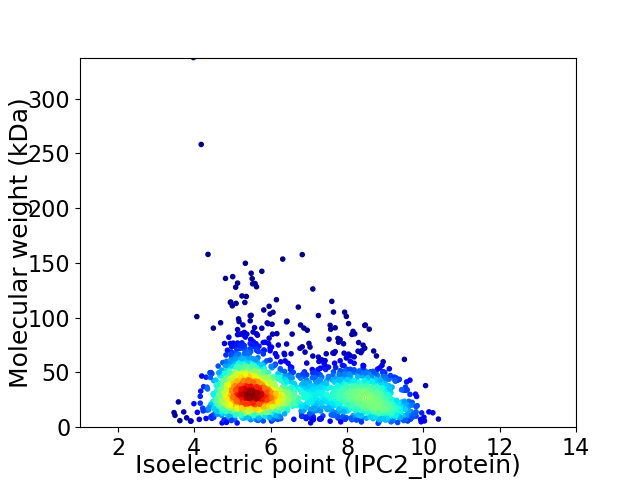
Virtual 2D-PAGE plot for 2073 proteins (isoelectric point calculated using IPC2_protein)
Get csv file with sequences according to given criteria:
* You can choose from 21 different methods for calculating isoelectric point
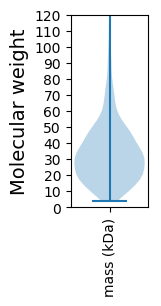
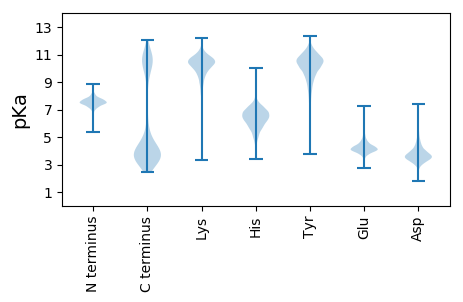
Summary statistics related to proteome-wise predictions


Protein with the lowest isoelectric point:
>tr|A0A239T8R0|A0A239T8R0_9FIRM NADPH azoreductase OS=Megamonas hypermegale OX=158847 GN=azr PE=4 SV=1
MM1 pKa = 7.19EE2 pKa = 5.42RR3 pKa = 11.84EE4 pKa = 3.91EE5 pKa = 4.25VLLKK9 pKa = 10.32IAQLISNNDD18 pKa = 2.9SDD20 pKa = 5.08VIIEE24 pKa = 4.06VEE26 pKa = 4.06EE27 pKa = 5.13CIDD30 pKa = 5.25DD31 pKa = 3.62IQKK34 pKa = 10.48YY35 pKa = 8.64VATHH39 pKa = 5.9LEE41 pKa = 4.26EE42 pKa = 5.48YY43 pKa = 9.83EE44 pKa = 4.13DD45 pKa = 4.6RR46 pKa = 11.84SMTLEE51 pKa = 4.77DD52 pKa = 5.29DD53 pKa = 4.69SEE55 pKa = 5.44EE56 pKa = 4.04DD57 pKa = 3.88LQWLGMVNCLIRR69 pKa = 11.84NNYY72 pKa = 9.0VYY74 pKa = 9.74EE75 pKa = 4.22TDD77 pKa = 4.57DD78 pKa = 3.37NVQITEE84 pKa = 4.56FGWEE88 pKa = 4.19LKK90 pKa = 10.22NLCGFKK96 pKa = 10.36EE97 pKa = 4.22YY98 pKa = 11.04GLSLDD103 pKa = 4.49SKK105 pKa = 10.94FLDD108 pKa = 2.9VDD110 pKa = 4.03YY111 pKa = 11.39GVDD114 pKa = 3.17RR115 pKa = 11.84YY116 pKa = 11.02DD117 pKa = 3.87INEE120 pKa = 4.42DD121 pKa = 3.64DD122 pKa = 4.97EE123 pKa = 6.04DD124 pKa = 4.39VFDD127 pKa = 4.49YY128 pKa = 11.36DD129 pKa = 3.82EE130 pKa = 5.16EE131 pKa = 4.59EE132 pKa = 5.78DD133 pKa = 5.58FIEE136 pKa = 5.31DD137 pKa = 3.69DD138 pKa = 6.3NIIGWCKK145 pKa = 10.52YY146 pKa = 10.63LDD148 pKa = 3.78NKK150 pKa = 9.1WADD153 pKa = 3.63EE154 pKa = 4.09NVCIGMININSDD166 pKa = 3.28SYY168 pKa = 11.38IIFPIDD174 pKa = 3.51CDD176 pKa = 3.73VLEE179 pKa = 4.49EE180 pKa = 4.97LEE182 pKa = 5.0DD183 pKa = 3.86LADD186 pKa = 4.22SIDD189 pKa = 3.46RR190 pKa = 11.84HH191 pKa = 5.74ISSVYY196 pKa = 10.22
MM1 pKa = 7.19EE2 pKa = 5.42RR3 pKa = 11.84EE4 pKa = 3.91EE5 pKa = 4.25VLLKK9 pKa = 10.32IAQLISNNDD18 pKa = 2.9SDD20 pKa = 5.08VIIEE24 pKa = 4.06VEE26 pKa = 4.06EE27 pKa = 5.13CIDD30 pKa = 5.25DD31 pKa = 3.62IQKK34 pKa = 10.48YY35 pKa = 8.64VATHH39 pKa = 5.9LEE41 pKa = 4.26EE42 pKa = 5.48YY43 pKa = 9.83EE44 pKa = 4.13DD45 pKa = 4.6RR46 pKa = 11.84SMTLEE51 pKa = 4.77DD52 pKa = 5.29DD53 pKa = 4.69SEE55 pKa = 5.44EE56 pKa = 4.04DD57 pKa = 3.88LQWLGMVNCLIRR69 pKa = 11.84NNYY72 pKa = 9.0VYY74 pKa = 9.74EE75 pKa = 4.22TDD77 pKa = 4.57DD78 pKa = 3.37NVQITEE84 pKa = 4.56FGWEE88 pKa = 4.19LKK90 pKa = 10.22NLCGFKK96 pKa = 10.36EE97 pKa = 4.22YY98 pKa = 11.04GLSLDD103 pKa = 4.49SKK105 pKa = 10.94FLDD108 pKa = 2.9VDD110 pKa = 4.03YY111 pKa = 11.39GVDD114 pKa = 3.17RR115 pKa = 11.84YY116 pKa = 11.02DD117 pKa = 3.87INEE120 pKa = 4.42DD121 pKa = 3.64DD122 pKa = 4.97EE123 pKa = 6.04DD124 pKa = 4.39VFDD127 pKa = 4.49YY128 pKa = 11.36DD129 pKa = 3.82EE130 pKa = 5.16EE131 pKa = 4.59EE132 pKa = 5.78DD133 pKa = 5.58FIEE136 pKa = 5.31DD137 pKa = 3.69DD138 pKa = 6.3NIIGWCKK145 pKa = 10.52YY146 pKa = 10.63LDD148 pKa = 3.78NKK150 pKa = 9.1WADD153 pKa = 3.63EE154 pKa = 4.09NVCIGMININSDD166 pKa = 3.28SYY168 pKa = 11.38IIFPIDD174 pKa = 3.51CDD176 pKa = 3.73VLEE179 pKa = 4.49EE180 pKa = 4.97LEE182 pKa = 5.0DD183 pKa = 3.86LADD186 pKa = 4.22SIDD189 pKa = 3.46RR190 pKa = 11.84HH191 pKa = 5.74ISSVYY196 pKa = 10.22
Molecular weight: 23.08 kDa
Isoelectric point according different methods:
Protein with the highest isoelectric point:
>tr|A0A239TK73|A0A239TK73_9FIRM Uncharacterized protein OS=Megamonas hypermegale OX=158847 GN=SAMEA4364220_00887 PE=4 SV=1
MM1 pKa = 7.49LKK3 pKa = 10.65DD4 pKa = 3.97KK5 pKa = 10.68IKK7 pKa = 9.64KK8 pKa = 7.48TVGILTMACFLATPIGYY25 pKa = 9.75VISASTTEE33 pKa = 4.47AAPPPPPPRR42 pKa = 11.84HH43 pKa = 6.34RR44 pKa = 11.84IEE46 pKa = 4.68APPPSHH52 pKa = 7.02HH53 pKa = 7.13KK54 pKa = 10.0GPSWKK59 pKa = 8.81RR60 pKa = 11.84TPPPPQHH67 pKa = 6.36RR68 pKa = 11.84WKK70 pKa = 10.39DD71 pKa = 3.36DD72 pKa = 2.9HH73 pKa = 6.93RR74 pKa = 11.84RR75 pKa = 11.84PDD77 pKa = 3.9APPPPPRR84 pKa = 11.84HH85 pKa = 4.95HH86 pKa = 7.71RR87 pKa = 11.84YY88 pKa = 9.39RR89 pKa = 5.14
MM1 pKa = 7.49LKK3 pKa = 10.65DD4 pKa = 3.97KK5 pKa = 10.68IKK7 pKa = 9.64KK8 pKa = 7.48TVGILTMACFLATPIGYY25 pKa = 9.75VISASTTEE33 pKa = 4.47AAPPPPPPRR42 pKa = 11.84HH43 pKa = 6.34RR44 pKa = 11.84IEE46 pKa = 4.68APPPSHH52 pKa = 7.02HH53 pKa = 7.13KK54 pKa = 10.0GPSWKK59 pKa = 8.81RR60 pKa = 11.84TPPPPQHH67 pKa = 6.36RR68 pKa = 11.84WKK70 pKa = 10.39DD71 pKa = 3.36DD72 pKa = 2.9HH73 pKa = 6.93RR74 pKa = 11.84RR75 pKa = 11.84PDD77 pKa = 3.9APPPPPRR84 pKa = 11.84HH85 pKa = 4.95HH86 pKa = 7.71RR87 pKa = 11.84YY88 pKa = 9.39RR89 pKa = 5.14
Molecular weight: 10.11 kDa
Isoelectric point according different methods:
Peptides (in silico digests for buttom-up proteomics)
Below you can find in silico digests of the whole proteome with Trypsin, Chymotrypsin, Trypsin+LysC, LysN, ArgC proteases suitable for different mass spec machines.| Try ESI |
 |
|---|
| ChTry ESI |
 |
|---|
| ArgC ESI |
 |
|---|
| LysN ESI |
 |
|---|
| TryLysC ESI |
 |
|---|
| Try MALDI |
 |
|---|
| ChTry MALDI |
 |
|---|
| ArgC MALDI |
 |
|---|
| LysN MALDI |
 |
|---|
| TryLysC MALDI |
 |
|---|
| Try LTQ |
 |
|---|
| ChTry LTQ |
 |
|---|
| ArgC LTQ |
 |
|---|
| LysN LTQ |
 |
|---|
| TryLysC LTQ |
 |
|---|
| Try MSlow |
 |
|---|
| ChTry MSlow |
 |
|---|
| ArgC MSlow |
 |
|---|
| LysN MSlow |
 |
|---|
| TryLysC MSlow |
 |
|---|
| Try MShigh |
 |
|---|
| ChTry MShigh |
 |
|---|
| ArgC MShigh |
 |
|---|
| LysN MShigh |
 |
|---|
| TryLysC MShigh |
 |
|---|
General Statistics
Number of major isoforms |
Number of additional isoforms |
Number of all proteins |
Number of amino acids |
Min. Seq. Length |
Max. Seq. Length |
Avg. Seq. Length |
Avg. Mol. Weight |
|---|---|---|---|---|---|---|---|
0 |
651883 |
30 |
3257 |
314.5 |
35.25 |
Amino acid frequency
Ala |
Cys |
Asp |
Glu |
Phe |
Gly |
His |
Ile |
Lys |
Leu |
|---|---|---|---|---|---|---|---|---|---|
7.443 ± 0.066 | 1.306 ± 0.023 |
5.721 ± 0.051 | 6.19 ± 0.052 |
4.328 ± 0.047 | 6.576 ± 0.052 |
1.829 ± 0.024 | 8.798 ± 0.065 |
7.728 ± 0.06 | 9.134 ± 0.066 |
Met |
Asn |
Gln |
Pro |
Arg |
Ser |
Thr |
Val |
Trp |
Tyr |
|---|---|---|---|---|---|---|---|---|---|
2.955 ± 0.027 | 5.508 ± 0.058 |
3.387 ± 0.033 | 3.254 ± 0.028 |
3.669 ± 0.037 | 5.46 ± 0.039 |
5.335 ± 0.054 | 6.632 ± 0.047 |
0.834 ± 0.02 | 3.913 ± 0.037 |
Most of the basic statistics you can see at this page can be downloaded from this CSV file
Proteome-pI is available under Creative Commons Attribution-NoDerivs license, for more details see here
| Reference: Kozlowski LP. Proteome-pI 2.0: Proteome Isoelectric Point Database Update. Nucleic Acids Res. 2021, doi: 10.1093/nar/gkab944 | Contact: Lukasz P. Kozlowski |
