Gordonia phage Bibwit
Taxonomy: Viruses; Duplodnaviria; Heunggongvirae; Uroviricota; Caudoviricetes; Caudovirales; Siphoviridae; Vividuovirus; unclassified Vividuovirus
Average proteome isoelectric point is 5.99
Get precalculated fractions of proteins

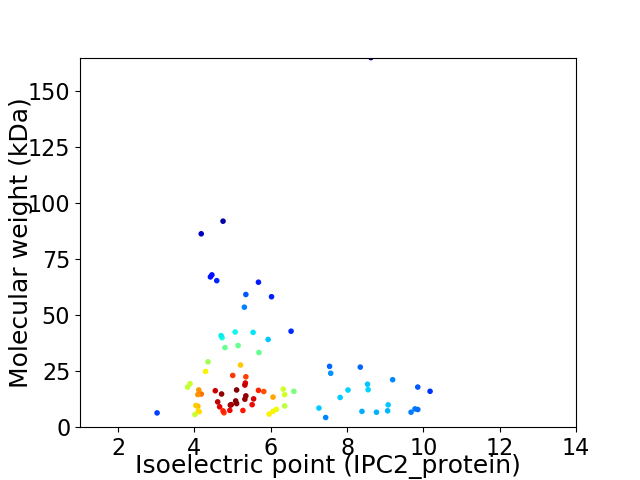
Virtual 2D-PAGE plot for 83 proteins (isoelectric point calculated using IPC2_protein)
Get csv file with sequences according to given criteria:
* You can choose from 21 different methods for calculating isoelectric point
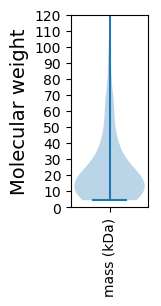
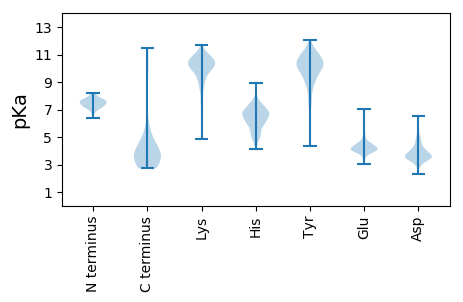
Summary statistics related to proteome-wise predictions


Protein with the lowest isoelectric point:
>tr|A0A3G3M7X0|A0A3G3M7X0_9CAUD Uncharacterized protein OS=Gordonia phage Bibwit OX=2483666 GN=59 PE=4 SV=1
MM1 pKa = 6.5KK2 pKa = 9.84TRR4 pKa = 11.84YY5 pKa = 9.27KK6 pKa = 10.74VLAGVGAFVVTLGIIGAVTDD26 pKa = 4.24DD27 pKa = 4.05GEE29 pKa = 4.37ATVRR33 pKa = 11.84GNDD36 pKa = 3.24VQTAAVLPSTTAPAHH51 pKa = 4.81TTVEE55 pKa = 4.06LDD57 pKa = 3.46EE58 pKa = 4.81PATIEE63 pKa = 4.16TTTTTEE69 pKa = 3.83APTVEE74 pKa = 4.53TVDD77 pKa = 3.84TPSVTVSQTQALEE90 pKa = 3.98SAEE93 pKa = 4.1QYY95 pKa = 10.15LAYY98 pKa = 10.68VGGFSRR104 pKa = 11.84AEE106 pKa = 4.43LIDD109 pKa = 3.43QLVYY113 pKa = 11.18EE114 pKa = 4.8DD115 pKa = 5.13FSRR118 pKa = 11.84ADD120 pKa = 3.58AEE122 pKa = 4.24WAVDD126 pKa = 3.5NVTVDD131 pKa = 2.89WFEE134 pKa = 3.93QAEE137 pKa = 4.45KK138 pKa = 10.74SAADD142 pKa = 3.65YY143 pKa = 11.2IEE145 pKa = 4.06FVGGFSYY152 pKa = 11.04QEE154 pKa = 4.06LVDD157 pKa = 3.64QLVYY161 pKa = 10.86EE162 pKa = 4.41QFTQEE167 pKa = 4.06QAEE170 pKa = 4.37HH171 pKa = 6.2GAKK174 pKa = 10.26SVDD177 pKa = 3.62LTPP180 pKa = 4.65
MM1 pKa = 6.5KK2 pKa = 9.84TRR4 pKa = 11.84YY5 pKa = 9.27KK6 pKa = 10.74VLAGVGAFVVTLGIIGAVTDD26 pKa = 4.24DD27 pKa = 4.05GEE29 pKa = 4.37ATVRR33 pKa = 11.84GNDD36 pKa = 3.24VQTAAVLPSTTAPAHH51 pKa = 4.81TTVEE55 pKa = 4.06LDD57 pKa = 3.46EE58 pKa = 4.81PATIEE63 pKa = 4.16TTTTTEE69 pKa = 3.83APTVEE74 pKa = 4.53TVDD77 pKa = 3.84TPSVTVSQTQALEE90 pKa = 3.98SAEE93 pKa = 4.1QYY95 pKa = 10.15LAYY98 pKa = 10.68VGGFSRR104 pKa = 11.84AEE106 pKa = 4.43LIDD109 pKa = 3.43QLVYY113 pKa = 11.18EE114 pKa = 4.8DD115 pKa = 5.13FSRR118 pKa = 11.84ADD120 pKa = 3.58AEE122 pKa = 4.24WAVDD126 pKa = 3.5NVTVDD131 pKa = 2.89WFEE134 pKa = 3.93QAEE137 pKa = 4.45KK138 pKa = 10.74SAADD142 pKa = 3.65YY143 pKa = 11.2IEE145 pKa = 4.06FVGGFSYY152 pKa = 11.04QEE154 pKa = 4.06LVDD157 pKa = 3.64QLVYY161 pKa = 10.86EE162 pKa = 4.41QFTQEE167 pKa = 4.06QAEE170 pKa = 4.37HH171 pKa = 6.2GAKK174 pKa = 10.26SVDD177 pKa = 3.62LTPP180 pKa = 4.65
Molecular weight: 19.44 kDa
Isoelectric point according different methods:
Protein with the highest isoelectric point:
>tr|A0A3G3M804|A0A3G3M804_9CAUD Portal protein OS=Gordonia phage Bibwit OX=2483666 GN=12 PE=4 SV=1
MM1 pKa = 7.26GWLLFGAVFIPVRR14 pKa = 11.84IAKK17 pKa = 9.9IIEE20 pKa = 4.48DD21 pKa = 3.61ALSPRR26 pKa = 11.84RR27 pKa = 11.84RR28 pKa = 11.84RR29 pKa = 11.84EE30 pKa = 3.9LIQQQTRR37 pKa = 11.84DD38 pKa = 3.68EE39 pKa = 4.24VAAAAEE45 pKa = 4.0RR46 pKa = 11.84SEE48 pKa = 4.04QYY50 pKa = 10.41RR51 pKa = 11.84RR52 pKa = 11.84TRR54 pKa = 11.84YY55 pKa = 10.13GLL57 pKa = 3.49
MM1 pKa = 7.26GWLLFGAVFIPVRR14 pKa = 11.84IAKK17 pKa = 9.9IIEE20 pKa = 4.48DD21 pKa = 3.61ALSPRR26 pKa = 11.84RR27 pKa = 11.84RR28 pKa = 11.84RR29 pKa = 11.84EE30 pKa = 3.9LIQQQTRR37 pKa = 11.84DD38 pKa = 3.68EE39 pKa = 4.24VAAAAEE45 pKa = 4.0RR46 pKa = 11.84SEE48 pKa = 4.04QYY50 pKa = 10.41RR51 pKa = 11.84RR52 pKa = 11.84TRR54 pKa = 11.84YY55 pKa = 10.13GLL57 pKa = 3.49
Molecular weight: 6.7 kDa
Isoelectric point according different methods:
Peptides (in silico digests for buttom-up proteomics)
Below you can find in silico digests of the whole proteome with Trypsin, Chymotrypsin, Trypsin+LysC, LysN, ArgC proteases suitable for different mass spec machines.| Try ESI |
 |
|---|
| ChTry ESI |
 |
|---|
| ArgC ESI |
 |
|---|
| LysN ESI |
 |
|---|
| TryLysC ESI |
 |
|---|
| Try MALDI |
 |
|---|
| ChTry MALDI |
 |
|---|
| ArgC MALDI |
 |
|---|
| LysN MALDI |
 |
|---|
| TryLysC MALDI |
 |
|---|
| Try LTQ |
 |
|---|
| ChTry LTQ |
 |
|---|
| ArgC LTQ |
 |
|---|
| LysN LTQ |
 |
|---|
| TryLysC LTQ |
 |
|---|
| Try MSlow |
 |
|---|
| ChTry MSlow |
 |
|---|
| ArgC MSlow |
 |
|---|
| LysN MSlow |
 |
|---|
| TryLysC MSlow |
 |
|---|
| Try MShigh |
 |
|---|
| ChTry MShigh |
 |
|---|
| ArgC MShigh |
 |
|---|
| LysN MShigh |
 |
|---|
| TryLysC MShigh |
 |
|---|
General Statistics
Number of major isoforms |
Number of additional isoforms |
Number of all proteins |
Number of amino acids |
Min. Seq. Length |
Max. Seq. Length |
Avg. Seq. Length |
Avg. Mol. Weight |
|---|---|---|---|---|---|---|---|
0 |
18431 |
37 |
1607 |
222.1 |
24.17 |
Amino acid frequency
Ala |
Cys |
Asp |
Glu |
Phe |
Gly |
His |
Ile |
Lys |
Leu |
|---|---|---|---|---|---|---|---|---|---|
11.947 ± 0.404 | 0.852 ± 0.126 |
7.732 ± 0.418 | 5.561 ± 0.344 |
2.463 ± 0.152 | 8.529 ± 0.474 |
2.317 ± 0.202 | 4.547 ± 0.267 |
2.48 ± 0.177 | 7.515 ± 0.245 |
Met |
Asn |
Gln |
Pro |
Arg |
Ser |
Thr |
Val |
Trp |
Tyr |
|---|---|---|---|---|---|---|---|---|---|
2.1 ± 0.105 | 2.68 ± 0.156 |
6.478 ± 0.209 | 3.776 ± 0.2 |
7.618 ± 0.442 | 4.731 ± 0.183 |
6.625 ± 0.279 | 7.791 ± 0.246 |
2.078 ± 0.104 | 2.181 ± 0.135 |
Most of the basic statistics you can see at this page can be downloaded from this CSV file
Proteome-pI is available under Creative Commons Attribution-NoDerivs license, for more details see here
| Reference: Kozlowski LP. Proteome-pI 2.0: Proteome Isoelectric Point Database Update. Nucleic Acids Res. 2021, doi: 10.1093/nar/gkab944 | Contact: Lukasz P. Kozlowski |
