Stenotrophomonas chelatiphaga
Taxonomy: cellular organisms; Bacteria; Proteobacteria; Gammaproteobacteria; Xanthomonadales; Xanthomonadaceae; Stenotrophomonas
Average proteome isoelectric point is 6.57
Get precalculated fractions of proteins

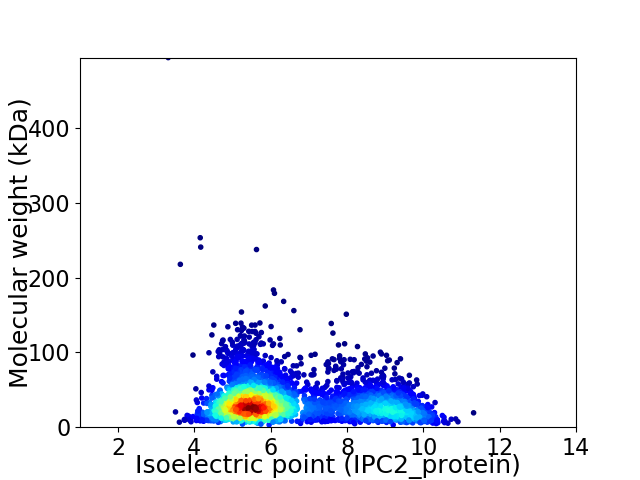
Virtual 2D-PAGE plot for 3376 proteins (isoelectric point calculated using IPC2_protein)
Get csv file with sequences according to given criteria:
* You can choose from 21 different methods for calculating isoelectric point
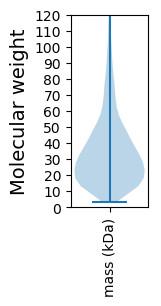
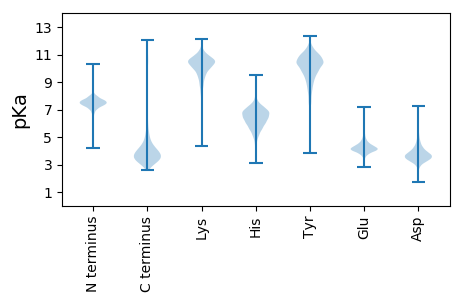
Summary statistics related to proteome-wise predictions


Protein with the lowest isoelectric point:
>tr|A0A0R0CU18|A0A0R0CU18_9GAMM LuxR family transcriptional regulator OS=Stenotrophomonas chelatiphaga OX=517011 GN=ABB28_10860 PE=4 SV=1
MM1 pKa = 7.21ATEE4 pKa = 4.85CIEE7 pKa = 3.9GRR9 pKa = 11.84HH10 pKa = 5.51FEE12 pKa = 4.53GEE14 pKa = 4.31HH15 pKa = 6.25PMSDD19 pKa = 3.21TPPAVFRR26 pKa = 11.84TWMCVVCGFLYY37 pKa = 10.75HH38 pKa = 6.74EE39 pKa = 5.09ADD41 pKa = 3.65GLPEE45 pKa = 4.0EE46 pKa = 5.59GIAAGTRR53 pKa = 11.84WEE55 pKa = 4.73DD56 pKa = 4.32VPDD59 pKa = 3.14TWTCPDD65 pKa = 3.91CGVTKK70 pKa = 10.7DD71 pKa = 3.65DD72 pKa = 4.21FEE74 pKa = 4.39MVEE77 pKa = 4.23LDD79 pKa = 3.29
MM1 pKa = 7.21ATEE4 pKa = 4.85CIEE7 pKa = 3.9GRR9 pKa = 11.84HH10 pKa = 5.51FEE12 pKa = 4.53GEE14 pKa = 4.31HH15 pKa = 6.25PMSDD19 pKa = 3.21TPPAVFRR26 pKa = 11.84TWMCVVCGFLYY37 pKa = 10.75HH38 pKa = 6.74EE39 pKa = 5.09ADD41 pKa = 3.65GLPEE45 pKa = 4.0EE46 pKa = 5.59GIAAGTRR53 pKa = 11.84WEE55 pKa = 4.73DD56 pKa = 4.32VPDD59 pKa = 3.14TWTCPDD65 pKa = 3.91CGVTKK70 pKa = 10.7DD71 pKa = 3.65DD72 pKa = 4.21FEE74 pKa = 4.39MVEE77 pKa = 4.23LDD79 pKa = 3.29
Molecular weight: 8.88 kDa
Isoelectric point according different methods:
Protein with the highest isoelectric point:
>tr|A0A0R0D4G3|A0A0R0D4G3_9GAMM Membrane protein OS=Stenotrophomonas chelatiphaga OX=517011 GN=ABB28_13950 PE=4 SV=1
MM1 pKa = 7.51RR2 pKa = 11.84QLSLADD8 pKa = 3.7RR9 pKa = 11.84GQTISLDD16 pKa = 3.66KK17 pKa = 11.3SPDD20 pKa = 3.53DD21 pKa = 3.82ATPICLSVARR31 pKa = 11.84LGSLQTAGSCFTVWIQVRR49 pKa = 11.84GSAWVEE55 pKa = 3.64AKK57 pKa = 10.12EE58 pKa = 4.14GRR60 pKa = 11.84FRR62 pKa = 11.84MRR64 pKa = 11.84RR65 pKa = 11.84GEE67 pKa = 3.87WIAFEE72 pKa = 4.34KK73 pKa = 10.51EE74 pKa = 3.93SRR76 pKa = 11.84PLVQAGRR83 pKa = 11.84SGLCIGLALNADD95 pKa = 4.2AMRR98 pKa = 11.84MLMEE102 pKa = 5.06LADD105 pKa = 4.17CGLYY109 pKa = 10.38AGRR112 pKa = 11.84GLMKK116 pKa = 10.28QAEE119 pKa = 4.41LRR121 pKa = 11.84VALRR125 pKa = 11.84LWRR128 pKa = 11.84DD129 pKa = 3.32ALDD132 pKa = 3.8SGLPAQALRR141 pKa = 11.84PMLLHH146 pKa = 6.77LASLQRR152 pKa = 11.84TMAGTVQRR160 pKa = 11.84CPGRR164 pKa = 11.84SRR166 pKa = 11.84SRR168 pKa = 11.84KK169 pKa = 7.5RR170 pKa = 11.84QVFGRR175 pKa = 11.84MQRR178 pKa = 11.84ARR180 pKa = 11.84LYY182 pKa = 11.22LEE184 pKa = 4.89GNSHH188 pKa = 5.53RR189 pKa = 11.84VVRR192 pKa = 11.84IGEE195 pKa = 4.15LAEE198 pKa = 4.01LTNFSSWYY206 pKa = 9.37LSKK209 pKa = 9.81TFQSLYY215 pKa = 10.41EE216 pKa = 4.23EE217 pKa = 4.85SPQALSARR225 pKa = 11.84LRR227 pKa = 11.84LEE229 pKa = 3.77RR230 pKa = 11.84AADD233 pKa = 3.99LLRR236 pKa = 11.84DD237 pKa = 3.51TDD239 pKa = 3.69MMIGEE244 pKa = 4.45VASASGFDD252 pKa = 3.65NCCSFARR259 pKa = 11.84AFRR262 pKa = 11.84ARR264 pKa = 11.84FGTSASHH271 pKa = 5.57YY272 pKa = 9.39RR273 pKa = 11.84EE274 pKa = 4.19SAAKK278 pKa = 10.43LSPHH282 pKa = 5.57SAKK285 pKa = 10.62SLAASRR291 pKa = 11.84KK292 pKa = 8.94PRR294 pKa = 11.84IATQSS299 pKa = 3.03
MM1 pKa = 7.51RR2 pKa = 11.84QLSLADD8 pKa = 3.7RR9 pKa = 11.84GQTISLDD16 pKa = 3.66KK17 pKa = 11.3SPDD20 pKa = 3.53DD21 pKa = 3.82ATPICLSVARR31 pKa = 11.84LGSLQTAGSCFTVWIQVRR49 pKa = 11.84GSAWVEE55 pKa = 3.64AKK57 pKa = 10.12EE58 pKa = 4.14GRR60 pKa = 11.84FRR62 pKa = 11.84MRR64 pKa = 11.84RR65 pKa = 11.84GEE67 pKa = 3.87WIAFEE72 pKa = 4.34KK73 pKa = 10.51EE74 pKa = 3.93SRR76 pKa = 11.84PLVQAGRR83 pKa = 11.84SGLCIGLALNADD95 pKa = 4.2AMRR98 pKa = 11.84MLMEE102 pKa = 5.06LADD105 pKa = 4.17CGLYY109 pKa = 10.38AGRR112 pKa = 11.84GLMKK116 pKa = 10.28QAEE119 pKa = 4.41LRR121 pKa = 11.84VALRR125 pKa = 11.84LWRR128 pKa = 11.84DD129 pKa = 3.32ALDD132 pKa = 3.8SGLPAQALRR141 pKa = 11.84PMLLHH146 pKa = 6.77LASLQRR152 pKa = 11.84TMAGTVQRR160 pKa = 11.84CPGRR164 pKa = 11.84SRR166 pKa = 11.84SRR168 pKa = 11.84KK169 pKa = 7.5RR170 pKa = 11.84QVFGRR175 pKa = 11.84MQRR178 pKa = 11.84ARR180 pKa = 11.84LYY182 pKa = 11.22LEE184 pKa = 4.89GNSHH188 pKa = 5.53RR189 pKa = 11.84VVRR192 pKa = 11.84IGEE195 pKa = 4.15LAEE198 pKa = 4.01LTNFSSWYY206 pKa = 9.37LSKK209 pKa = 9.81TFQSLYY215 pKa = 10.41EE216 pKa = 4.23EE217 pKa = 4.85SPQALSARR225 pKa = 11.84LRR227 pKa = 11.84LEE229 pKa = 3.77RR230 pKa = 11.84AADD233 pKa = 3.99LLRR236 pKa = 11.84DD237 pKa = 3.51TDD239 pKa = 3.69MMIGEE244 pKa = 4.45VASASGFDD252 pKa = 3.65NCCSFARR259 pKa = 11.84AFRR262 pKa = 11.84ARR264 pKa = 11.84FGTSASHH271 pKa = 5.57YY272 pKa = 9.39RR273 pKa = 11.84EE274 pKa = 4.19SAAKK278 pKa = 10.43LSPHH282 pKa = 5.57SAKK285 pKa = 10.62SLAASRR291 pKa = 11.84KK292 pKa = 8.94PRR294 pKa = 11.84IATQSS299 pKa = 3.03
Molecular weight: 33.22 kDa
Isoelectric point according different methods:
Peptides (in silico digests for buttom-up proteomics)
Below you can find in silico digests of the whole proteome with Trypsin, Chymotrypsin, Trypsin+LysC, LysN, ArgC proteases suitable for different mass spec machines.| Try ESI |
 |
|---|
| ChTry ESI |
 |
|---|
| ArgC ESI |
 |
|---|
| LysN ESI |
 |
|---|
| TryLysC ESI |
 |
|---|
| Try MALDI |
 |
|---|
| ChTry MALDI |
 |
|---|
| ArgC MALDI |
 |
|---|
| LysN MALDI |
 |
|---|
| TryLysC MALDI |
 |
|---|
| Try LTQ |
 |
|---|
| ChTry LTQ |
 |
|---|
| ArgC LTQ |
 |
|---|
| LysN LTQ |
 |
|---|
| TryLysC LTQ |
 |
|---|
| Try MSlow |
 |
|---|
| ChTry MSlow |
 |
|---|
| ArgC MSlow |
 |
|---|
| LysN MSlow |
 |
|---|
| TryLysC MSlow |
 |
|---|
| Try MShigh |
 |
|---|
| ChTry MShigh |
 |
|---|
| ArgC MShigh |
 |
|---|
| LysN MShigh |
 |
|---|
| TryLysC MShigh |
 |
|---|
General Statistics
Number of major isoforms |
Number of additional isoforms |
Number of all proteins |
Number of amino acids |
Min. Seq. Length |
Max. Seq. Length |
Avg. Seq. Length |
Avg. Mol. Weight |
|---|---|---|---|---|---|---|---|
0 |
1140280 |
29 |
5071 |
337.8 |
36.56 |
Amino acid frequency
Ala |
Cys |
Asp |
Glu |
Phe |
Gly |
His |
Ile |
Lys |
Leu |
|---|---|---|---|---|---|---|---|---|---|
13.109 ± 0.067 | 0.765 ± 0.013 |
5.834 ± 0.031 | 5.033 ± 0.04 |
3.297 ± 0.026 | 8.691 ± 0.046 |
2.205 ± 0.025 | 4.035 ± 0.031 |
2.562 ± 0.033 | 11.039 ± 0.059 |
Met |
Asn |
Gln |
Pro |
Arg |
Ser |
Thr |
Val |
Trp |
Tyr |
|---|---|---|---|---|---|---|---|---|---|
2.185 ± 0.02 | 2.576 ± 0.038 |
5.286 ± 0.034 | 4.325 ± 0.033 |
7.329 ± 0.055 | 5.417 ± 0.037 |
4.943 ± 0.041 | 7.596 ± 0.043 |
1.539 ± 0.024 | 2.233 ± 0.023 |
Most of the basic statistics you can see at this page can be downloaded from this CSV file
Proteome-pI is available under Creative Commons Attribution-NoDerivs license, for more details see here
| Reference: Kozlowski LP. Proteome-pI 2.0: Proteome Isoelectric Point Database Update. Nucleic Acids Res. 2021, doi: 10.1093/nar/gkab944 | Contact: Lukasz P. Kozlowski |
