Charleville virus
Taxonomy: Viruses; Riboviria; Orthornavirae; Negarnaviricota; Haploviricotina; Monjiviricetes; Mononegavirales; Rhabdoviridae; Alpharhabdovirinae; Sripuvirus; Charleville sripuvirus
Average proteome isoelectric point is 6.32
Get precalculated fractions of proteins

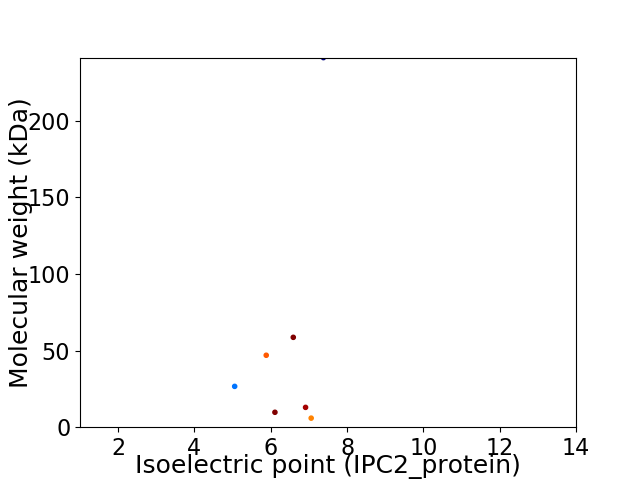
Virtual 2D-PAGE plot for 7 proteins (isoelectric point calculated using IPC2_protein)
Get csv file with sequences according to given criteria:
* You can choose from 21 different methods for calculating isoelectric point
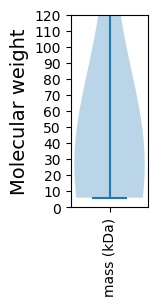
Summary statistics related to proteome-wise predictions


Protein with the lowest isoelectric point:
>tr|A0A3Q8TND9|A0A3Q8TND9_9RHAB Gx OS=Charleville virus OX=318842 GN=Gx PE=4 SV=1
MM1 pKa = 7.51NNLLSCKK8 pKa = 10.48DD9 pKa = 4.17KK10 pKa = 10.98IPKK13 pKa = 9.71NLLLAAIQVEE23 pKa = 4.71SKK25 pKa = 10.95NNEE28 pKa = 3.73SSKK31 pKa = 10.98LFGPQEE37 pKa = 4.04FQEE40 pKa = 4.51DD41 pKa = 4.63SPTEE45 pKa = 3.96SDD47 pKa = 3.55GGSSSSHH54 pKa = 6.31KK55 pKa = 10.66SFTPASPVDD64 pKa = 3.58ARR66 pKa = 11.84CYY68 pKa = 8.21TIPGIGLPKK77 pKa = 9.48TQEE80 pKa = 3.86EE81 pKa = 4.84LNNRR85 pKa = 11.84IASLLGAVFEE95 pKa = 4.6TTGLSISGLKK105 pKa = 8.27VTANSITFHH114 pKa = 6.59EE115 pKa = 4.41IEE117 pKa = 4.11EE118 pKa = 4.66DD119 pKa = 3.43EE120 pKa = 4.71LEE122 pKa = 4.09EE123 pKa = 4.78SEE125 pKa = 4.23RR126 pKa = 11.84TEE128 pKa = 4.02SGGSSEE134 pKa = 5.64LIKK137 pKa = 10.55FDD139 pKa = 3.7SKK141 pKa = 11.71SPGGTNPFLPAEE153 pKa = 4.43KK154 pKa = 9.86SISPIPEE161 pKa = 3.97VSSMIQDD168 pKa = 3.7FLAEE172 pKa = 4.38LEE174 pKa = 4.11AGFYY178 pKa = 8.6LTSITNKK185 pKa = 9.57PLYY188 pKa = 10.24VDD190 pKa = 3.91RR191 pKa = 11.84KK192 pKa = 10.29KK193 pKa = 10.54LTLTKK198 pKa = 10.55EE199 pKa = 4.44SILLWEE205 pKa = 4.5TQPGWSKK212 pKa = 9.96TKK214 pKa = 10.18ILRR217 pKa = 11.84EE218 pKa = 3.59ACKK221 pKa = 9.73RR222 pKa = 11.84DD223 pKa = 3.09KK224 pKa = 11.0VLRR227 pKa = 11.84GKK229 pKa = 10.68LGMVSWTDD237 pKa = 3.36SLQNDD242 pKa = 3.92PP243 pKa = 5.11
MM1 pKa = 7.51NNLLSCKK8 pKa = 10.48DD9 pKa = 4.17KK10 pKa = 10.98IPKK13 pKa = 9.71NLLLAAIQVEE23 pKa = 4.71SKK25 pKa = 10.95NNEE28 pKa = 3.73SSKK31 pKa = 10.98LFGPQEE37 pKa = 4.04FQEE40 pKa = 4.51DD41 pKa = 4.63SPTEE45 pKa = 3.96SDD47 pKa = 3.55GGSSSSHH54 pKa = 6.31KK55 pKa = 10.66SFTPASPVDD64 pKa = 3.58ARR66 pKa = 11.84CYY68 pKa = 8.21TIPGIGLPKK77 pKa = 9.48TQEE80 pKa = 3.86EE81 pKa = 4.84LNNRR85 pKa = 11.84IASLLGAVFEE95 pKa = 4.6TTGLSISGLKK105 pKa = 8.27VTANSITFHH114 pKa = 6.59EE115 pKa = 4.41IEE117 pKa = 4.11EE118 pKa = 4.66DD119 pKa = 3.43EE120 pKa = 4.71LEE122 pKa = 4.09EE123 pKa = 4.78SEE125 pKa = 4.23RR126 pKa = 11.84TEE128 pKa = 4.02SGGSSEE134 pKa = 5.64LIKK137 pKa = 10.55FDD139 pKa = 3.7SKK141 pKa = 11.71SPGGTNPFLPAEE153 pKa = 4.43KK154 pKa = 9.86SISPIPEE161 pKa = 3.97VSSMIQDD168 pKa = 3.7FLAEE172 pKa = 4.38LEE174 pKa = 4.11AGFYY178 pKa = 8.6LTSITNKK185 pKa = 9.57PLYY188 pKa = 10.24VDD190 pKa = 3.91RR191 pKa = 11.84KK192 pKa = 10.29KK193 pKa = 10.54LTLTKK198 pKa = 10.55EE199 pKa = 4.44SILLWEE205 pKa = 4.5TQPGWSKK212 pKa = 9.96TKK214 pKa = 10.18ILRR217 pKa = 11.84EE218 pKa = 3.59ACKK221 pKa = 9.73RR222 pKa = 11.84DD223 pKa = 3.09KK224 pKa = 11.0VLRR227 pKa = 11.84GKK229 pKa = 10.68LGMVSWTDD237 pKa = 3.36SLQNDD242 pKa = 3.92PP243 pKa = 5.11
Molecular weight: 26.66 kDa
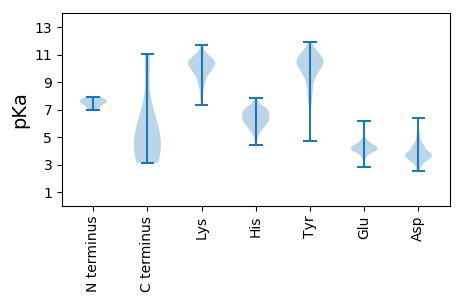
Isoelectric point according different methods:
Protein with the highest isoelectric point:
>tr|A0A3S8TMQ0|A0A3S8TMQ0_9RHAB Matrix protein OS=Charleville virus OX=318842 GN=M PE=4 SV=1
MM1 pKa = 7.6LIEE4 pKa = 5.02SGLKK8 pKa = 8.49VTYY11 pKa = 10.02QVGVQEE17 pKa = 4.31EE18 pKa = 4.71SVEE21 pKa = 4.1KK22 pKa = 10.65LLSEE26 pKa = 4.38EE27 pKa = 4.22VTGTRR32 pKa = 11.84GRR34 pKa = 11.84TLSKK38 pKa = 10.09SYY40 pKa = 10.46KK41 pKa = 9.72RR42 pKa = 11.84QGTLLSQFPNCC53 pKa = 4.95
MM1 pKa = 7.6LIEE4 pKa = 5.02SGLKK8 pKa = 8.49VTYY11 pKa = 10.02QVGVQEE17 pKa = 4.31EE18 pKa = 4.71SVEE21 pKa = 4.1KK22 pKa = 10.65LLSEE26 pKa = 4.38EE27 pKa = 4.22VTGTRR32 pKa = 11.84GRR34 pKa = 11.84TLSKK38 pKa = 10.09SYY40 pKa = 10.46KK41 pKa = 9.72RR42 pKa = 11.84QGTLLSQFPNCC53 pKa = 4.95
Molecular weight: 5.92 kDa
Isoelectric point according different methods:
Peptides (in silico digests for buttom-up proteomics)
Below you can find in silico digests of the whole proteome with Trypsin, Chymotrypsin, Trypsin+LysC, LysN, ArgC proteases suitable for different mass spec machines.| Try ESI |
 |
|---|
| ChTry ESI |
 |
|---|
| ArgC ESI |
 |
|---|
| LysN ESI |
 |
|---|
| TryLysC ESI |
 |
|---|
| Try MALDI |
 |
|---|
| ChTry MALDI |
 |
|---|
| ArgC MALDI |
 |
|---|
| LysN MALDI |
 |
|---|
| TryLysC MALDI |
 |
|---|
| Try LTQ |
 |
|---|
| ChTry LTQ |
 |
|---|
| ArgC LTQ |
 |
|---|
| LysN LTQ |
 |
|---|
| TryLysC LTQ |
 |
|---|
| Try MSlow |
 |
|---|
| ChTry MSlow |
 |
|---|
| ArgC MSlow |
 |
|---|
| LysN MSlow |
 |
|---|
| TryLysC MSlow |
 |
|---|
| Try MShigh |
 |
|---|
| ChTry MShigh |
 |
|---|
| ArgC MShigh |
 |
|---|
| LysN MShigh |
 |
|---|
| TryLysC MShigh |
 |
|---|
General Statistics
Number of major isoforms |
Number of additional isoforms |
Number of all proteins |
Number of amino acids |
Min. Seq. Length |
Max. Seq. Length |
Avg. Seq. Length |
Avg. Mol. Weight |
|---|---|---|---|---|---|---|---|
0 |
3518 |
53 |
2090 |
502.6 |
57.46 |
Amino acid frequency
Ala |
Cys |
Asp |
Glu |
Phe |
Gly |
His |
Ile |
Lys |
Leu |
|---|---|---|---|---|---|---|---|---|---|
3.781 ± 0.825 | 2.16 ± 0.162 |
4.775 ± 0.396 | 7.106 ± 0.538 |
4.491 ± 0.31 | 6.168 ± 0.543 |
2.302 ± 0.291 | 8.13 ± 0.96 |
7.192 ± 0.3 | 9.75 ± 1.068 |
Met |
Asn |
Gln |
Pro |
Arg |
Ser |
Thr |
Val |
Trp |
Tyr |
|---|---|---|---|---|---|---|---|---|---|
2.615 ± 0.304 | 5.088 ± 0.834 |
4.036 ± 0.619 | 3.07 ± 0.215 |
4.775 ± 0.443 | 7.789 ± 1.095 |
6.339 ± 0.166 | 5.003 ± 0.657 |
1.819 ± 0.288 | 3.61 ± 0.52 |
Most of the basic statistics you can see at this page can be downloaded from this CSV file
Proteome-pI is available under Creative Commons Attribution-NoDerivs license, for more details see here
| Reference: Kozlowski LP. Proteome-pI 2.0: Proteome Isoelectric Point Database Update. Nucleic Acids Res. 2021, doi: 10.1093/nar/gkab944 | Contact: Lukasz P. Kozlowski |
