Mycoplasma verecundum
Taxonomy: cellular organisms; Bacteria; Terrabacteria group; Tenericutes; Mollicutes; Mycoplasmatales; Mycoplasmataceae; Mycoplasmopsis
Average proteome isoelectric point is 7.02
Get precalculated fractions of proteins

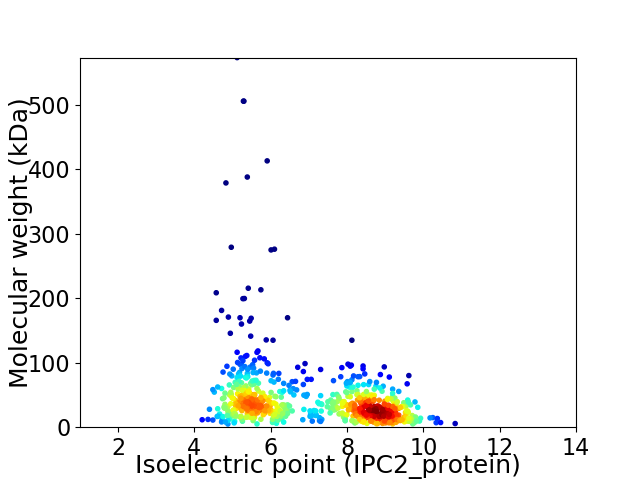
Virtual 2D-PAGE plot for 671 proteins (isoelectric point calculated using IPC2_protein)
Get csv file with sequences according to given criteria:
* You can choose from 21 different methods for calculating isoelectric point
Summary statistics related to proteome-wise predictions


Protein with the lowest isoelectric point:
>tr|A0A1T4LXJ3|A0A1T4LXJ3_9MOLU DNA-directed RNA polymerase subunit beta OS=Mycoplasma verecundum OX=171291 GN=rpoB PE=3 SV=1
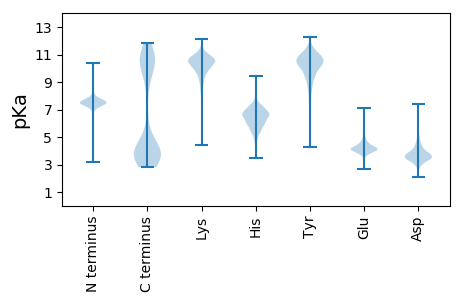
MM1 pKa = 7.32FFSLSLNAISTIMNQFVNHH20 pKa = 7.31LISKK24 pKa = 10.08QITCKK29 pKa = 10.39SDD31 pKa = 2.71NCLYY35 pKa = 10.44CCNINHH41 pKa = 6.6IFKK44 pKa = 10.72SFSALCCKK52 pKa = 10.3QYY54 pKa = 11.33QSLFWKK60 pKa = 10.6LPIFNEE66 pKa = 4.49KK67 pKa = 9.52IDD69 pKa = 4.66FIDD72 pKa = 3.63PGIYY76 pKa = 10.02SDD78 pKa = 4.95DD79 pKa = 4.12DD80 pKa = 3.71KK81 pKa = 11.54LGPVYY86 pKa = 10.37MPDD89 pKa = 3.32DD90 pKa = 4.44VYY92 pKa = 11.59EE93 pKa = 4.18EE94 pKa = 4.58TPPTTTITFNEE105 pKa = 4.43FLNHH109 pKa = 6.51LLFFASNVFYY119 pKa = 11.04DD120 pKa = 4.09KK121 pKa = 11.1FLDD124 pKa = 3.92VYY126 pKa = 10.92NTFNDD131 pKa = 3.52SKK133 pKa = 11.48QDD135 pKa = 3.51FTLSSWNHH143 pKa = 5.56WYY145 pKa = 10.51FDD147 pKa = 5.05DD148 pKa = 7.12DD149 pKa = 5.87DD150 pKa = 5.92DD151 pKa = 6.05LLTKK155 pKa = 10.64LFVEE159 pKa = 4.49KK160 pKa = 10.49EE161 pKa = 4.47GNFSLEE167 pKa = 3.58MKK169 pKa = 8.9MFPKK173 pKa = 9.77IYY175 pKa = 9.5EE176 pKa = 4.2IPLLSYY182 pKa = 9.77WNQIMPKK189 pKa = 10.18EE190 pKa = 4.23KK191 pKa = 9.27ITNNEE196 pKa = 3.6YY197 pKa = 10.82LFNHH201 pKa = 7.6IIPKK205 pKa = 10.4AFFNSFPNNNISCYY219 pKa = 10.21DD220 pKa = 3.41FSEE223 pKa = 4.72PGVLPMEE230 pKa = 4.92DD231 pKa = 3.5EE232 pKa = 4.56YY233 pKa = 11.55EE234 pKa = 3.99
MM1 pKa = 7.32FFSLSLNAISTIMNQFVNHH20 pKa = 7.31LISKK24 pKa = 10.08QITCKK29 pKa = 10.39SDD31 pKa = 2.71NCLYY35 pKa = 10.44CCNINHH41 pKa = 6.6IFKK44 pKa = 10.72SFSALCCKK52 pKa = 10.3QYY54 pKa = 11.33QSLFWKK60 pKa = 10.6LPIFNEE66 pKa = 4.49KK67 pKa = 9.52IDD69 pKa = 4.66FIDD72 pKa = 3.63PGIYY76 pKa = 10.02SDD78 pKa = 4.95DD79 pKa = 4.12DD80 pKa = 3.71KK81 pKa = 11.54LGPVYY86 pKa = 10.37MPDD89 pKa = 3.32DD90 pKa = 4.44VYY92 pKa = 11.59EE93 pKa = 4.18EE94 pKa = 4.58TPPTTTITFNEE105 pKa = 4.43FLNHH109 pKa = 6.51LLFFASNVFYY119 pKa = 11.04DD120 pKa = 4.09KK121 pKa = 11.1FLDD124 pKa = 3.92VYY126 pKa = 10.92NTFNDD131 pKa = 3.52SKK133 pKa = 11.48QDD135 pKa = 3.51FTLSSWNHH143 pKa = 5.56WYY145 pKa = 10.51FDD147 pKa = 5.05DD148 pKa = 7.12DD149 pKa = 5.87DD150 pKa = 5.92DD151 pKa = 6.05LLTKK155 pKa = 10.64LFVEE159 pKa = 4.49KK160 pKa = 10.49EE161 pKa = 4.47GNFSLEE167 pKa = 3.58MKK169 pKa = 8.9MFPKK173 pKa = 9.77IYY175 pKa = 9.5EE176 pKa = 4.2IPLLSYY182 pKa = 9.77WNQIMPKK189 pKa = 10.18EE190 pKa = 4.23KK191 pKa = 9.27ITNNEE196 pKa = 3.6YY197 pKa = 10.82LFNHH201 pKa = 7.6IIPKK205 pKa = 10.4AFFNSFPNNNISCYY219 pKa = 10.21DD220 pKa = 3.41FSEE223 pKa = 4.72PGVLPMEE230 pKa = 4.92DD231 pKa = 3.5EE232 pKa = 4.56YY233 pKa = 11.55EE234 pKa = 3.99
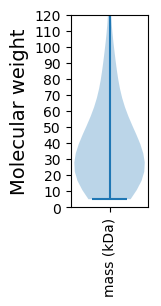
Molecular weight: 27.78 kDa
Isoelectric point according different methods:
Protein with the highest isoelectric point:
>tr|A0A1T4KUK5|A0A1T4KUK5_9MOLU 50S ribosomal protein L24 OS=Mycoplasma verecundum OX=171291 GN=rplX PE=3 SV=1
MM1 pKa = 7.34ARR3 pKa = 11.84KK4 pKa = 9.46ALIEE8 pKa = 3.93KK9 pKa = 10.2AKK11 pKa = 10.03RR12 pKa = 11.84HH13 pKa = 5.81PKK15 pKa = 10.03FSTRR19 pKa = 11.84AYY21 pKa = 8.48TRR23 pKa = 11.84CEE25 pKa = 3.78LCGRR29 pKa = 11.84PHH31 pKa = 6.83SVLRR35 pKa = 11.84KK36 pKa = 9.13YY37 pKa = 10.01KK38 pKa = 9.42VCRR41 pKa = 11.84ICFRR45 pKa = 11.84NLAHH49 pKa = 6.85EE50 pKa = 4.47GKK52 pKa = 10.15IPGMKK57 pKa = 9.27KK58 pKa = 10.56ASWW61 pKa = 3.19
MM1 pKa = 7.34ARR3 pKa = 11.84KK4 pKa = 9.46ALIEE8 pKa = 3.93KK9 pKa = 10.2AKK11 pKa = 10.03RR12 pKa = 11.84HH13 pKa = 5.81PKK15 pKa = 10.03FSTRR19 pKa = 11.84AYY21 pKa = 8.48TRR23 pKa = 11.84CEE25 pKa = 3.78LCGRR29 pKa = 11.84PHH31 pKa = 6.83SVLRR35 pKa = 11.84KK36 pKa = 9.13YY37 pKa = 10.01KK38 pKa = 9.42VCRR41 pKa = 11.84ICFRR45 pKa = 11.84NLAHH49 pKa = 6.85EE50 pKa = 4.47GKK52 pKa = 10.15IPGMKK57 pKa = 9.27KK58 pKa = 10.56ASWW61 pKa = 3.19
Molecular weight: 7.16 kDa
Isoelectric point according different methods:
Peptides (in silico digests for buttom-up proteomics)
Below you can find in silico digests of the whole proteome with Trypsin, Chymotrypsin, Trypsin+LysC, LysN, ArgC proteases suitable for different mass spec machines.| Try ESI |
 |
|---|
| ChTry ESI |
 |
|---|
| ArgC ESI |
 |
|---|
| LysN ESI |
 |
|---|
| TryLysC ESI |
 |
|---|
| Try MALDI |
 |
|---|
| ChTry MALDI |
 |
|---|
| ArgC MALDI |
 |
|---|
| LysN MALDI |
 |
|---|
| TryLysC MALDI |
 |
|---|
| Try LTQ |
 |
|---|
| ChTry LTQ |
 |
|---|
| ArgC LTQ |
 |
|---|
| LysN LTQ |
 |
|---|
| TryLysC LTQ |
 |
|---|
| Try MSlow |
 |
|---|
| ChTry MSlow |
 |
|---|
| ArgC MSlow |
 |
|---|
| LysN MSlow |
 |
|---|
| TryLysC MSlow |
 |
|---|
| Try MShigh |
 |
|---|
| ChTry MShigh |
 |
|---|
| ArgC MShigh |
 |
|---|
| LysN MShigh |
 |
|---|
| TryLysC MShigh |
 |
|---|
General Statistics
Number of major isoforms |
Number of additional isoforms |
Number of all proteins |
Number of amino acids |
Min. Seq. Length |
Max. Seq. Length |
Avg. Seq. Length |
Avg. Mol. Weight |
|---|---|---|---|---|---|---|---|
0 |
266221 |
39 |
5067 |
396.8 |
45.37 |
Amino acid frequency
Ala |
Cys |
Asp |
Glu |
Phe |
Gly |
His |
Ile |
Lys |
Leu |
|---|---|---|---|---|---|---|---|---|---|
5.758 ± 0.156 | 0.469 ± 0.034 |
6.034 ± 0.131 | 6.464 ± 0.105 |
4.746 ± 0.127 | 4.319 ± 0.113 |
1.38 ± 0.054 | 9.056 ± 0.158 |
9.633 ± 0.17 | 9.467 ± 0.077 |
Met |
Asn |
Gln |
Pro |
Arg |
Ser |
Thr |
Val |
Trp |
Tyr |
|---|---|---|---|---|---|---|---|---|---|
1.811 ± 0.061 | 8.473 ± 0.2 |
2.748 ± 0.054 | 3.896 ± 0.105 |
2.771 ± 0.081 | 6.59 ± 0.074 |
5.464 ± 0.093 | 5.532 ± 0.097 |
0.896 ± 0.033 | 4.493 ± 0.098 |
Most of the basic statistics you can see at this page can be downloaded from this CSV file
Proteome-pI is available under Creative Commons Attribution-NoDerivs license, for more details see here
| Reference: Kozlowski LP. Proteome-pI 2.0: Proteome Isoelectric Point Database Update. Nucleic Acids Res. 2021, doi: 10.1093/nar/gkab944 | Contact: Lukasz P. Kozlowski |
