Indian citrus ringspot virus (isolate Kinnow mandarin/India/K1/1996) (ICRSV)
Taxonomy: Viruses; Riboviria; Orthornavirae; Kitrinoviricota; Alsuviricetes; Tymovirales; Alphaflexiviridae; Potexvirus; Mandarivirus; Indian citrus ringspot virus
Average proteome isoelectric point is 7.08
Get precalculated fractions of proteins

Virtual 2D-PAGE plot for 6 proteins (isoelectric point calculated using IPC2_protein)
Get csv file with sequences according to given criteria:
* You can choose from 21 different methods for calculating isoelectric point
Summary statistics related to proteome-wise predictions


Protein with the lowest isoelectric point:
>sp|Q918W3|RDRP_ICRSV RNA replication protein OS=Indian citrus ringspot virus (isolate Kinnow mandarin/India/K1/1996) OX=651357 GN=ORF1 PE=3 SV=1
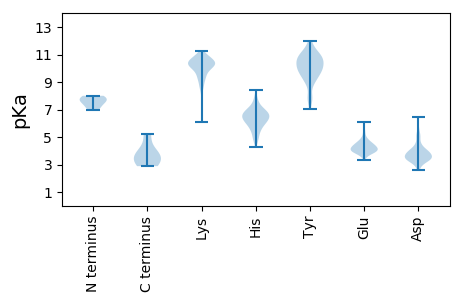
MM1 pKa = 8.0DD2 pKa = 4.34FAEE5 pKa = 4.55LLEE8 pKa = 4.69SKK10 pKa = 10.8AFTRR14 pKa = 11.84TRR16 pKa = 11.84LPLSKK21 pKa = 9.93PIVVHH26 pKa = 6.53AVAGAGKK33 pKa = 8.62TSLLEE38 pKa = 3.76NYY40 pKa = 10.21ARR42 pKa = 11.84INPAARR48 pKa = 11.84IYY50 pKa = 10.62TPIAQQSNSLLLSPFTQSLEE70 pKa = 3.86QADD73 pKa = 3.98IVDD76 pKa = 5.06EE77 pKa = 4.59YY78 pKa = 10.69PLSTLHH84 pKa = 6.88PGVEE88 pKa = 4.38YY89 pKa = 11.18VLADD93 pKa = 4.6PIQYY97 pKa = 10.49LGSKK101 pKa = 10.38DD102 pKa = 3.79LLKK105 pKa = 10.45PHH107 pKa = 6.73YY108 pKa = 9.82ICPTTHH114 pKa = 7.23RR115 pKa = 11.84FGHH118 pKa = 5.34STAEE122 pKa = 4.1FLTSLGIEE130 pKa = 4.67TYY132 pKa = 9.95AHH134 pKa = 6.51KK135 pKa = 10.08PDD137 pKa = 4.13RR138 pKa = 11.84LTIANIFKK146 pKa = 9.79TEE148 pKa = 3.69PHH150 pKa = 6.07GQVIACDD157 pKa = 4.27LDD159 pKa = 4.03TQQLAARR166 pKa = 11.84HH167 pKa = 5.56SLDD170 pKa = 3.35YY171 pKa = 11.01LRR173 pKa = 11.84PCQSIGKK180 pKa = 6.12TFKK183 pKa = 10.24DD184 pKa = 3.3TTILISHH191 pKa = 6.91EE192 pKa = 4.36LNRR195 pKa = 11.84DD196 pKa = 3.39TLTKK200 pKa = 10.04EE201 pKa = 3.56IYY203 pKa = 9.86IALTRR208 pKa = 11.84HH209 pKa = 5.4TNSVTILTPDD219 pKa = 3.44APSTSSS225 pKa = 2.88
MM1 pKa = 8.0DD2 pKa = 4.34FAEE5 pKa = 4.55LLEE8 pKa = 4.69SKK10 pKa = 10.8AFTRR14 pKa = 11.84TRR16 pKa = 11.84LPLSKK21 pKa = 9.93PIVVHH26 pKa = 6.53AVAGAGKK33 pKa = 8.62TSLLEE38 pKa = 3.76NYY40 pKa = 10.21ARR42 pKa = 11.84INPAARR48 pKa = 11.84IYY50 pKa = 10.62TPIAQQSNSLLLSPFTQSLEE70 pKa = 3.86QADD73 pKa = 3.98IVDD76 pKa = 5.06EE77 pKa = 4.59YY78 pKa = 10.69PLSTLHH84 pKa = 6.88PGVEE88 pKa = 4.38YY89 pKa = 11.18VLADD93 pKa = 4.6PIQYY97 pKa = 10.49LGSKK101 pKa = 10.38DD102 pKa = 3.79LLKK105 pKa = 10.45PHH107 pKa = 6.73YY108 pKa = 9.82ICPTTHH114 pKa = 7.23RR115 pKa = 11.84FGHH118 pKa = 5.34STAEE122 pKa = 4.1FLTSLGIEE130 pKa = 4.67TYY132 pKa = 9.95AHH134 pKa = 6.51KK135 pKa = 10.08PDD137 pKa = 4.13RR138 pKa = 11.84LTIANIFKK146 pKa = 9.79TEE148 pKa = 3.69PHH150 pKa = 6.07GQVIACDD157 pKa = 4.27LDD159 pKa = 4.03TQQLAARR166 pKa = 11.84HH167 pKa = 5.56SLDD170 pKa = 3.35YY171 pKa = 11.01LRR173 pKa = 11.84PCQSIGKK180 pKa = 6.12TFKK183 pKa = 10.24DD184 pKa = 3.3TTILISHH191 pKa = 6.91EE192 pKa = 4.36LNRR195 pKa = 11.84DD196 pKa = 3.39TLTKK200 pKa = 10.04EE201 pKa = 3.56IYY203 pKa = 9.86IALTRR208 pKa = 11.84HH209 pKa = 5.4TNSVTILTPDD219 pKa = 3.44APSTSSS225 pKa = 2.88
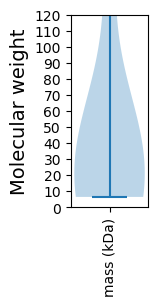
Molecular weight: 24.95 kDa
Isoelectric point according different methods:
Protein with the highest isoelectric point:
>sp|Q918W2|TGB1_ICRSV Movement and silencing protein TGBp1 OS=Indian citrus ringspot virus (isolate Kinnow mandarin/India/K1/1996) OX=651357 GN=ORF2 PE=3 SV=1
MM1 pKa = 7.9PLQPPPDD8 pKa = 3.75HH9 pKa = 6.28TWAVRR14 pKa = 11.84IIALGLAVTALIFTSTRR31 pKa = 11.84DD32 pKa = 3.48TSRR35 pKa = 11.84HH36 pKa = 5.34VGDD39 pKa = 5.07PSHH42 pKa = 6.68SLPFGGHH49 pKa = 5.16YY50 pKa = 9.98RR51 pKa = 11.84DD52 pKa = 3.68GSKK55 pKa = 10.45VIHH58 pKa = 6.1YY59 pKa = 7.61NSPRR63 pKa = 11.84SSKK66 pKa = 10.31PSNHH70 pKa = 5.59TPYY73 pKa = 11.29LLFAPIGIILLIHH86 pKa = 6.51ALHH89 pKa = 6.78RR90 pKa = 11.84LGNSAHH96 pKa = 6.97ICRR99 pKa = 11.84CTHH102 pKa = 6.46CMPHH106 pKa = 5.92SQTT109 pKa = 3.84
MM1 pKa = 7.9PLQPPPDD8 pKa = 3.75HH9 pKa = 6.28TWAVRR14 pKa = 11.84IIALGLAVTALIFTSTRR31 pKa = 11.84DD32 pKa = 3.48TSRR35 pKa = 11.84HH36 pKa = 5.34VGDD39 pKa = 5.07PSHH42 pKa = 6.68SLPFGGHH49 pKa = 5.16YY50 pKa = 9.98RR51 pKa = 11.84DD52 pKa = 3.68GSKK55 pKa = 10.45VIHH58 pKa = 6.1YY59 pKa = 7.61NSPRR63 pKa = 11.84SSKK66 pKa = 10.31PSNHH70 pKa = 5.59TPYY73 pKa = 11.29LLFAPIGIILLIHH86 pKa = 6.51ALHH89 pKa = 6.78RR90 pKa = 11.84LGNSAHH96 pKa = 6.97ICRR99 pKa = 11.84CTHH102 pKa = 6.46CMPHH106 pKa = 5.92SQTT109 pKa = 3.84
Molecular weight: 12.02 kDa
Isoelectric point according different methods:
Peptides (in silico digests for buttom-up proteomics)
Below you can find in silico digests of the whole proteome with Trypsin, Chymotrypsin, Trypsin+LysC, LysN, ArgC proteases suitable for different mass spec machines.| Try ESI |
 |
|---|
| ChTry ESI |
 |
|---|
| ArgC ESI |
 |
|---|
| LysN ESI |
 |
|---|
| TryLysC ESI |
 |
|---|
| Try MALDI |
 |
|---|
| ChTry MALDI |
 |
|---|
| ArgC MALDI |
 |
|---|
| LysN MALDI |
 |
|---|
| TryLysC MALDI |
 |
|---|
| Try LTQ |
 |
|---|
| ChTry LTQ |
 |
|---|
| ArgC LTQ |
 |
|---|
| LysN LTQ |
 |
|---|
| TryLysC LTQ |
 |
|---|
| Try MSlow |
 |
|---|
| ChTry MSlow |
 |
|---|
| ArgC MSlow |
 |
|---|
| LysN MSlow |
 |
|---|
| TryLysC MSlow |
 |
|---|
| Try MShigh |
 |
|---|
| ChTry MShigh |
 |
|---|
| ArgC MShigh |
 |
|---|
| LysN MShigh |
 |
|---|
| TryLysC MShigh |
 |
|---|
General Statistics
Number of major isoforms |
Number of additional isoforms |
Number of all proteins |
Number of amino acids |
Min. Seq. Length |
Max. Seq. Length |
Avg. Seq. Length |
Avg. Mol. Weight |
|---|---|---|---|---|---|---|---|
0 |
2599 |
60 |
1658 |
433.2 |
48.64 |
Amino acid frequency
Ala |
Cys |
Asp |
Glu |
Phe |
Gly |
His |
Ile |
Lys |
Leu |
|---|---|---|---|---|---|---|---|---|---|
8.119 ± 0.668 | 2.193 ± 0.427 |
5.194 ± 0.286 | 5.04 ± 0.75 |
3.694 ± 0.347 | 4.502 ± 0.29 |
4.04 ± 0.597 | 5.387 ± 0.61 |
5.04 ± 0.679 | 9.504 ± 0.973 |
Met |
Asn |
Gln |
Pro |
Arg |
Ser |
Thr |
Val |
Trp |
Tyr |
|---|---|---|---|---|---|---|---|---|---|
1.616 ± 0.289 | 4.656 ± 0.677 |
7.734 ± 1.64 | 4.117 ± 0.711 |
5.541 ± 1.047 | 6.272 ± 0.844 |
8.195 ± 0.889 | 4.656 ± 0.381 |
1.308 ± 0.31 | 3.194 ± 0.232 |
Most of the basic statistics you can see at this page can be downloaded from this CSV file
Proteome-pI is available under Creative Commons Attribution-NoDerivs license, for more details see here
| Reference: Kozlowski LP. Proteome-pI 2.0: Proteome Isoelectric Point Database Update. Nucleic Acids Res. 2021, doi: 10.1093/nar/gkab944 | Contact: Lukasz P. Kozlowski |
