Flavimobilis soli
Taxonomy: cellular organisms; Bacteria; Terrabacteria group; Actinobacteria; Actinomycetia; Micrococcales; Jonesiaceae; Flavimobilis
Average proteome isoelectric point is 6.01
Get precalculated fractions of proteins

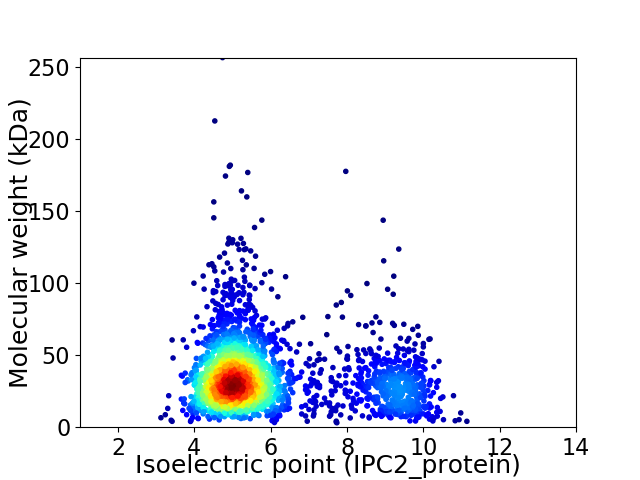
Virtual 2D-PAGE plot for 2501 proteins (isoelectric point calculated using IPC2_protein)
Get csv file with sequences according to given criteria:
* You can choose from 21 different methods for calculating isoelectric point
Summary statistics related to proteome-wise predictions


Protein with the lowest isoelectric point:
>tr|A0A2A9EC68|A0A2A9EC68_9MICO Serine hydroxymethyltransferase OS=Flavimobilis soli OX=442709 GN=glyA PE=3 SV=1
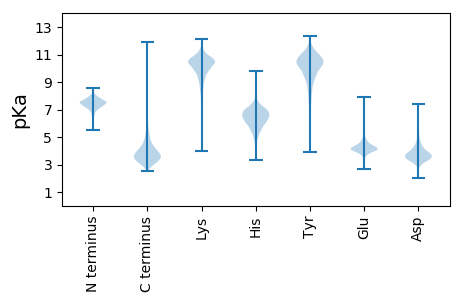
MM1 pKa = 7.17TKK3 pKa = 10.22SRR5 pKa = 11.84LCRR8 pKa = 11.84GVMAGSVLVLLLAGCSDD25 pKa = 4.5DD26 pKa = 5.02PEE28 pKa = 4.61TPAPGTTGASSTTTDD43 pKa = 3.72PAEE46 pKa = 4.54TPQGPALCAEE56 pKa = 4.46EE57 pKa = 4.69TVADD61 pKa = 3.92PASFATAGEE70 pKa = 4.15IVAVQDD76 pKa = 3.91EE77 pKa = 4.39MSEE80 pKa = 4.08AAGTSWRR87 pKa = 11.84RR88 pKa = 11.84YY89 pKa = 8.63VPVTVTNPGTATCRR103 pKa = 11.84VKK105 pKa = 11.13AFVTVEE111 pKa = 4.02GDD113 pKa = 3.01GGAYY117 pKa = 9.61EE118 pKa = 4.81VDD120 pKa = 3.4TADD123 pKa = 3.84VVLEE127 pKa = 4.38PGATANVQLFNLDD140 pKa = 3.66DD141 pKa = 3.82VVEE144 pKa = 4.3FDD146 pKa = 4.4GDD148 pKa = 4.0TEE150 pKa = 4.4GGQPVEE156 pKa = 4.11QLTIAVQEE164 pKa = 4.27VATWPVYY171 pKa = 10.48DD172 pKa = 4.59YY173 pKa = 11.69YY174 pKa = 11.44DD175 pKa = 4.34ADD177 pKa = 3.9VEE179 pKa = 4.67FGAVSGEE186 pKa = 4.16GADD189 pKa = 3.29AVLPVTITKK198 pKa = 10.15KK199 pKa = 10.19AVRR202 pKa = 11.84DD203 pKa = 4.04GVPAPYY209 pKa = 10.82GLTPQDD215 pKa = 3.21DD216 pKa = 4.77VYY218 pKa = 11.15IQGVDD223 pKa = 2.97ASGAVVAHH231 pKa = 6.25FSAWALEE238 pKa = 4.32AIEE241 pKa = 4.47VGEE244 pKa = 4.28TTTYY248 pKa = 10.03EE249 pKa = 3.95IPATIAARR257 pKa = 11.84YY258 pKa = 9.54DD259 pKa = 3.66YY260 pKa = 10.84EE261 pKa = 5.54KK262 pKa = 11.07DD263 pKa = 3.48PEE265 pKa = 4.42FPSYY269 pKa = 11.0AYY271 pKa = 10.02QGLSATEE278 pKa = 4.21DD279 pKa = 3.36VAEE282 pKa = 4.0YY283 pKa = 10.13RR284 pKa = 11.84VVRR287 pKa = 11.84FEE289 pKa = 4.03PAFLEE294 pKa = 4.59DD295 pKa = 3.37
MM1 pKa = 7.17TKK3 pKa = 10.22SRR5 pKa = 11.84LCRR8 pKa = 11.84GVMAGSVLVLLLAGCSDD25 pKa = 4.5DD26 pKa = 5.02PEE28 pKa = 4.61TPAPGTTGASSTTTDD43 pKa = 3.72PAEE46 pKa = 4.54TPQGPALCAEE56 pKa = 4.46EE57 pKa = 4.69TVADD61 pKa = 3.92PASFATAGEE70 pKa = 4.15IVAVQDD76 pKa = 3.91EE77 pKa = 4.39MSEE80 pKa = 4.08AAGTSWRR87 pKa = 11.84RR88 pKa = 11.84YY89 pKa = 8.63VPVTVTNPGTATCRR103 pKa = 11.84VKK105 pKa = 11.13AFVTVEE111 pKa = 4.02GDD113 pKa = 3.01GGAYY117 pKa = 9.61EE118 pKa = 4.81VDD120 pKa = 3.4TADD123 pKa = 3.84VVLEE127 pKa = 4.38PGATANVQLFNLDD140 pKa = 3.66DD141 pKa = 3.82VVEE144 pKa = 4.3FDD146 pKa = 4.4GDD148 pKa = 4.0TEE150 pKa = 4.4GGQPVEE156 pKa = 4.11QLTIAVQEE164 pKa = 4.27VATWPVYY171 pKa = 10.48DD172 pKa = 4.59YY173 pKa = 11.69YY174 pKa = 11.44DD175 pKa = 4.34ADD177 pKa = 3.9VEE179 pKa = 4.67FGAVSGEE186 pKa = 4.16GADD189 pKa = 3.29AVLPVTITKK198 pKa = 10.15KK199 pKa = 10.19AVRR202 pKa = 11.84DD203 pKa = 4.04GVPAPYY209 pKa = 10.82GLTPQDD215 pKa = 3.21DD216 pKa = 4.77VYY218 pKa = 11.15IQGVDD223 pKa = 2.97ASGAVVAHH231 pKa = 6.25FSAWALEE238 pKa = 4.32AIEE241 pKa = 4.47VGEE244 pKa = 4.28TTTYY248 pKa = 10.03EE249 pKa = 3.95IPATIAARR257 pKa = 11.84YY258 pKa = 9.54DD259 pKa = 3.66YY260 pKa = 10.84EE261 pKa = 5.54KK262 pKa = 11.07DD263 pKa = 3.48PEE265 pKa = 4.42FPSYY269 pKa = 11.0AYY271 pKa = 10.02QGLSATEE278 pKa = 4.21DD279 pKa = 3.36VAEE282 pKa = 4.0YY283 pKa = 10.13RR284 pKa = 11.84VVRR287 pKa = 11.84FEE289 pKa = 4.03PAFLEE294 pKa = 4.59DD295 pKa = 3.37
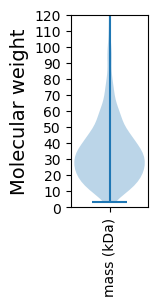
Molecular weight: 31.03 kDa
Isoelectric point according different methods:
Protein with the highest isoelectric point:
>tr|A0A2A9ED64|A0A2A9ED64_9MICO ThiF family protein OS=Flavimobilis soli OX=442709 GN=ATL41_0930 PE=4 SV=1
MM1 pKa = 7.4GSVIKK6 pKa = 10.42KK7 pKa = 8.47RR8 pKa = 11.84RR9 pKa = 11.84KK10 pKa = 9.22RR11 pKa = 11.84MAKK14 pKa = 9.41KK15 pKa = 9.87KK16 pKa = 9.7HH17 pKa = 5.84RR18 pKa = 11.84KK19 pKa = 8.56LLRR22 pKa = 11.84KK23 pKa = 7.78TRR25 pKa = 11.84HH26 pKa = 3.65QRR28 pKa = 11.84RR29 pKa = 11.84NKK31 pKa = 9.78KK32 pKa = 9.85
MM1 pKa = 7.4GSVIKK6 pKa = 10.42KK7 pKa = 8.47RR8 pKa = 11.84RR9 pKa = 11.84KK10 pKa = 9.22RR11 pKa = 11.84MAKK14 pKa = 9.41KK15 pKa = 9.87KK16 pKa = 9.7HH17 pKa = 5.84RR18 pKa = 11.84KK19 pKa = 8.56LLRR22 pKa = 11.84KK23 pKa = 7.78TRR25 pKa = 11.84HH26 pKa = 3.65QRR28 pKa = 11.84RR29 pKa = 11.84NKK31 pKa = 9.78KK32 pKa = 9.85
Molecular weight: 4.08 kDa
Isoelectric point according different methods:
Peptides (in silico digests for buttom-up proteomics)
Below you can find in silico digests of the whole proteome with Trypsin, Chymotrypsin, Trypsin+LysC, LysN, ArgC proteases suitable for different mass spec machines.| Try ESI |
 |
|---|
| ChTry ESI |
 |
|---|
| ArgC ESI |
 |
|---|
| LysN ESI |
 |
|---|
| TryLysC ESI |
 |
|---|
| Try MALDI |
 |
|---|
| ChTry MALDI |
 |
|---|
| ArgC MALDI |
 |
|---|
| LysN MALDI |
 |
|---|
| TryLysC MALDI |
 |
|---|
| Try LTQ |
 |
|---|
| ChTry LTQ |
 |
|---|
| ArgC LTQ |
 |
|---|
| LysN LTQ |
 |
|---|
| TryLysC LTQ |
 |
|---|
| Try MSlow |
 |
|---|
| ChTry MSlow |
 |
|---|
| ArgC MSlow |
 |
|---|
| LysN MSlow |
 |
|---|
| TryLysC MSlow |
 |
|---|
| Try MShigh |
 |
|---|
| ChTry MShigh |
 |
|---|
| ArgC MShigh |
 |
|---|
| LysN MShigh |
 |
|---|
| TryLysC MShigh |
 |
|---|
General Statistics
Number of major isoforms |
Number of additional isoforms |
Number of all proteins |
Number of amino acids |
Min. Seq. Length |
Max. Seq. Length |
Avg. Seq. Length |
Avg. Mol. Weight |
|---|---|---|---|---|---|---|---|
0 |
860565 |
30 |
2427 |
344.1 |
36.56 |
Amino acid frequency
Ala |
Cys |
Asp |
Glu |
Phe |
Gly |
His |
Ile |
Lys |
Leu |
|---|---|---|---|---|---|---|---|---|---|
14.058 ± 0.08 | 0.574 ± 0.012 |
6.311 ± 0.043 | 5.712 ± 0.048 |
2.596 ± 0.026 | 9.012 ± 0.04 |
1.99 ± 0.023 | 3.426 ± 0.032 |
2.076 ± 0.041 | 9.993 ± 0.061 |
Met |
Asn |
Gln |
Pro |
Arg |
Ser |
Thr |
Val |
Trp |
Tyr |
|---|---|---|---|---|---|---|---|---|---|
1.714 ± 0.019 | 1.68 ± 0.021 |
5.637 ± 0.04 | 2.662 ± 0.023 |
7.491 ± 0.049 | 5.383 ± 0.036 |
6.458 ± 0.047 | 10.055 ± 0.046 |
1.367 ± 0.019 | 1.804 ± 0.025 |
Most of the basic statistics you can see at this page can be downloaded from this CSV file
Proteome-pI is available under Creative Commons Attribution-NoDerivs license, for more details see here
| Reference: Kozlowski LP. Proteome-pI 2.0: Proteome Isoelectric Point Database Update. Nucleic Acids Res. 2021, doi: 10.1093/nar/gkab944 | Contact: Lukasz P. Kozlowski |
