Fructilactobacillus fructivorans
Taxonomy: cellular organisms; Bacteria; Terrabacteria group; Firmicutes; Bacilli; Lactobacillales; Lactobacillaceae; Fructilactobacillus
Average proteome isoelectric point is 6.78
Get precalculated fractions of proteins

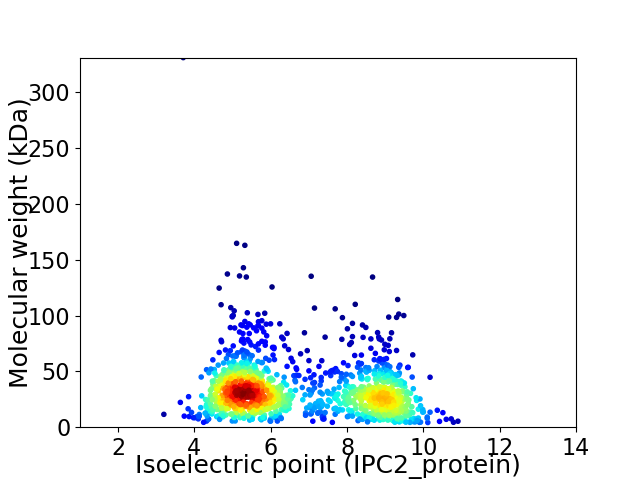
Virtual 2D-PAGE plot for 1281 proteins (isoelectric point calculated using IPC2_protein)
Get csv file with sequences according to given criteria:
* You can choose from 21 different methods for calculating isoelectric point
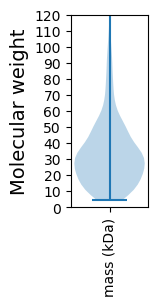
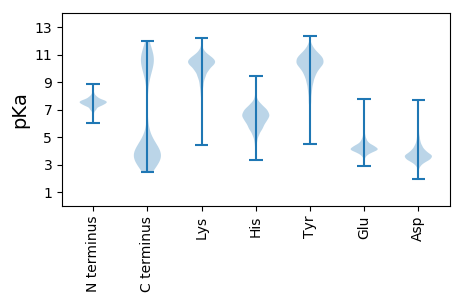
Summary statistics related to proteome-wise predictions


Protein with the lowest isoelectric point:
>tr|A0A0C1LZ35|A0A0C1LZ35_9LACO Putative ribosomal protein OS=Fructilactobacillus fructivorans OX=1614 GN=LF543_03025 PE=4 SV=1
MM1 pKa = 7.87IYY3 pKa = 11.02GEE5 pKa = 4.1FASFYY10 pKa = 11.2DD11 pKa = 3.57EE12 pKa = 5.88LFDD15 pKa = 4.74NEE17 pKa = 5.87LYY19 pKa = 10.82KK20 pKa = 10.51KK21 pKa = 8.4WCNFVVSNVPKK32 pKa = 10.27SARR35 pKa = 11.84ILDD38 pKa = 4.35LACGTGRR45 pKa = 11.84LLVQLKK51 pKa = 9.68NAGYY55 pKa = 9.43QVAGADD61 pKa = 4.49LSDD64 pKa = 4.91DD65 pKa = 3.63MLAIANDD72 pKa = 3.84HH73 pKa = 6.46LNEE76 pKa = 4.08NGIFDD81 pKa = 4.4VEE83 pKa = 4.51LINANMLDD91 pKa = 4.08LDD93 pKa = 4.33GLPKK97 pKa = 10.6YY98 pKa = 10.54GAITCFDD105 pKa = 4.19DD106 pKa = 5.15SICYY110 pKa = 9.03LANIDD115 pKa = 4.38QVMQMFAQVRR125 pKa = 11.84NHH127 pKa = 6.48LSSNGKK133 pKa = 9.36FLFDD137 pKa = 4.96VITPYY142 pKa = 9.29QTDD145 pKa = 3.03IVYY148 pKa = 9.86PGYY151 pKa = 10.06MFNTNDD157 pKa = 3.38GDD159 pKa = 4.53HH160 pKa = 6.83AFMWNTFIGKK170 pKa = 8.85VPHH173 pKa = 6.39SVEE176 pKa = 4.05HH177 pKa = 6.72DD178 pKa = 3.49LSFFDD183 pKa = 4.93YY184 pKa = 10.87NHH186 pKa = 6.63EE187 pKa = 4.03LDD189 pKa = 5.79AFDD192 pKa = 5.41EE193 pKa = 4.43YY194 pKa = 11.79NEE196 pKa = 4.18THH198 pKa = 7.19KK199 pKa = 10.96EE200 pKa = 3.65RR201 pKa = 11.84TYY203 pKa = 11.69SLVEE207 pKa = 3.83YY208 pKa = 10.73QDD210 pKa = 3.8ALKK213 pKa = 10.86SAGFNNVRR221 pKa = 11.84VSSDD225 pKa = 3.28FGNDD229 pKa = 2.95EE230 pKa = 4.03VHH232 pKa = 7.86DD233 pKa = 4.09DD234 pKa = 3.38TTRR237 pKa = 11.84WFFVCSEE244 pKa = 4.17EE245 pKa = 4.34
MM1 pKa = 7.87IYY3 pKa = 11.02GEE5 pKa = 4.1FASFYY10 pKa = 11.2DD11 pKa = 3.57EE12 pKa = 5.88LFDD15 pKa = 4.74NEE17 pKa = 5.87LYY19 pKa = 10.82KK20 pKa = 10.51KK21 pKa = 8.4WCNFVVSNVPKK32 pKa = 10.27SARR35 pKa = 11.84ILDD38 pKa = 4.35LACGTGRR45 pKa = 11.84LLVQLKK51 pKa = 9.68NAGYY55 pKa = 9.43QVAGADD61 pKa = 4.49LSDD64 pKa = 4.91DD65 pKa = 3.63MLAIANDD72 pKa = 3.84HH73 pKa = 6.46LNEE76 pKa = 4.08NGIFDD81 pKa = 4.4VEE83 pKa = 4.51LINANMLDD91 pKa = 4.08LDD93 pKa = 4.33GLPKK97 pKa = 10.6YY98 pKa = 10.54GAITCFDD105 pKa = 4.19DD106 pKa = 5.15SICYY110 pKa = 9.03LANIDD115 pKa = 4.38QVMQMFAQVRR125 pKa = 11.84NHH127 pKa = 6.48LSSNGKK133 pKa = 9.36FLFDD137 pKa = 4.96VITPYY142 pKa = 9.29QTDD145 pKa = 3.03IVYY148 pKa = 9.86PGYY151 pKa = 10.06MFNTNDD157 pKa = 3.38GDD159 pKa = 4.53HH160 pKa = 6.83AFMWNTFIGKK170 pKa = 8.85VPHH173 pKa = 6.39SVEE176 pKa = 4.05HH177 pKa = 6.72DD178 pKa = 3.49LSFFDD183 pKa = 4.93YY184 pKa = 10.87NHH186 pKa = 6.63EE187 pKa = 4.03LDD189 pKa = 5.79AFDD192 pKa = 5.41EE193 pKa = 4.43YY194 pKa = 11.79NEE196 pKa = 4.18THH198 pKa = 7.19KK199 pKa = 10.96EE200 pKa = 3.65RR201 pKa = 11.84TYY203 pKa = 11.69SLVEE207 pKa = 3.83YY208 pKa = 10.73QDD210 pKa = 3.8ALKK213 pKa = 10.86SAGFNNVRR221 pKa = 11.84VSSDD225 pKa = 3.28FGNDD229 pKa = 2.95EE230 pKa = 4.03VHH232 pKa = 7.86DD233 pKa = 4.09DD234 pKa = 3.38TTRR237 pKa = 11.84WFFVCSEE244 pKa = 4.17EE245 pKa = 4.34
Molecular weight: 28.05 kDa
Isoelectric point according different methods:
Protein with the highest isoelectric point:
>tr|A0A0C1PMJ3|A0A0C1PMJ3_9LACO DUF3324 domain-containing protein OS=Fructilactobacillus fructivorans OX=1614 GN=LfDm3_0645 PE=4 SV=1
MM1 pKa = 7.63NFLTKK6 pKa = 10.59NSLPIGFRR14 pKa = 11.84KK15 pKa = 9.53IKK17 pKa = 10.17NIPNIVKK24 pKa = 10.46NNVRR28 pKa = 11.84VLRR31 pKa = 11.84TIRR34 pKa = 11.84NGLKK38 pKa = 10.31
MM1 pKa = 7.63NFLTKK6 pKa = 10.59NSLPIGFRR14 pKa = 11.84KK15 pKa = 9.53IKK17 pKa = 10.17NIPNIVKK24 pKa = 10.46NNVRR28 pKa = 11.84VLRR31 pKa = 11.84TIRR34 pKa = 11.84NGLKK38 pKa = 10.31
Molecular weight: 4.42 kDa
Isoelectric point according different methods:
Peptides (in silico digests for buttom-up proteomics)
Below you can find in silico digests of the whole proteome with Trypsin, Chymotrypsin, Trypsin+LysC, LysN, ArgC proteases suitable for different mass spec machines.| Try ESI |
 |
|---|
| ChTry ESI |
 |
|---|
| ArgC ESI |
 |
|---|
| LysN ESI |
 |
|---|
| TryLysC ESI |
 |
|---|
| Try MALDI |
 |
|---|
| ChTry MALDI |
 |
|---|
| ArgC MALDI |
 |
|---|
| LysN MALDI |
 |
|---|
| TryLysC MALDI |
 |
|---|
| Try LTQ |
 |
|---|
| ChTry LTQ |
 |
|---|
| ArgC LTQ |
 |
|---|
| LysN LTQ |
 |
|---|
| TryLysC LTQ |
 |
|---|
| Try MSlow |
 |
|---|
| ChTry MSlow |
 |
|---|
| ArgC MSlow |
 |
|---|
| LysN MSlow |
 |
|---|
| TryLysC MSlow |
 |
|---|
| Try MShigh |
 |
|---|
| ChTry MShigh |
 |
|---|
| ArgC MShigh |
 |
|---|
| LysN MShigh |
 |
|---|
| TryLysC MShigh |
 |
|---|
General Statistics
Number of major isoforms |
Number of additional isoforms |
Number of all proteins |
Number of amino acids |
Min. Seq. Length |
Max. Seq. Length |
Avg. Seq. Length |
Avg. Mol. Weight |
|---|---|---|---|---|---|---|---|
0 |
397748 |
37 |
3377 |
310.5 |
34.73 |
Amino acid frequency
Ala |
Cys |
Asp |
Glu |
Phe |
Gly |
His |
Ile |
Lys |
Leu |
|---|---|---|---|---|---|---|---|---|---|
6.813 ± 0.061 | 0.445 ± 0.016 |
6.592 ± 0.08 | 5.157 ± 0.084 |
4.291 ± 0.068 | 6.696 ± 0.064 |
2.149 ± 0.029 | 7.623 ± 0.076 |
7.592 ± 0.082 | 8.867 ± 0.079 |
Met |
Asn |
Gln |
Pro |
Arg |
Ser |
Thr |
Val |
Trp |
Tyr |
|---|---|---|---|---|---|---|---|---|---|
2.867 ± 0.032 | 5.788 ± 0.061 |
3.676 ± 0.045 | 4.107 ± 0.052 |
3.681 ± 0.061 | 6.515 ± 0.278 |
5.491 ± 0.071 | 7.204 ± 0.056 |
0.896 ± 0.028 | 3.551 ± 0.047 |
Most of the basic statistics you can see at this page can be downloaded from this CSV file
Proteome-pI is available under Creative Commons Attribution-NoDerivs license, for more details see here
| Reference: Kozlowski LP. Proteome-pI 2.0: Proteome Isoelectric Point Database Update. Nucleic Acids Res. 2021, doi: 10.1093/nar/gkab944 | Contact: Lukasz P. Kozlowski |
