Flavihumibacter sp. ZG627
Taxonomy: cellular organisms; Bacteria; FCB group; Bacteroidetes/Chlorobi group; Bacteroidetes; Chitinophagia; Chitinophagales; Chitinophagaceae; Flavihumibacter; unclassified Flavihumibacter
Average proteome isoelectric point is 6.73
Get precalculated fractions of proteins

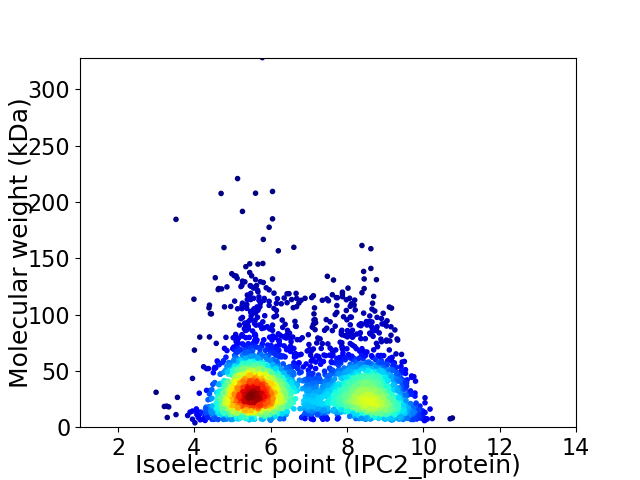
Virtual 2D-PAGE plot for 3302 proteins (isoelectric point calculated using IPC2_protein)
Get csv file with sequences according to given criteria:
* You can choose from 21 different methods for calculating isoelectric point
Summary statistics related to proteome-wise predictions


Protein with the lowest isoelectric point:
>tr|A0A0C1INA1|A0A0C1INA1_9BACT 2-oxoglutarate reductase OS=Flavihumibacter sp. ZG627 OX=1463156 GN=HY58_06615 PE=3 SV=1
MM1 pKa = 7.6LWTACQKK8 pKa = 10.17EE9 pKa = 4.35VSPEE13 pKa = 3.45ASIQNEE19 pKa = 4.05IEE21 pKa = 4.27SADD24 pKa = 3.66LRR26 pKa = 11.84LSGVLEE32 pKa = 4.19EE33 pKa = 6.15DD34 pKa = 3.3EE35 pKa = 4.61SHH37 pKa = 6.29WNIIPVISSQNTMLKK52 pKa = 10.09PATTGKK58 pKa = 9.43PGAGGKK64 pKa = 9.94VKK66 pKa = 10.79DD67 pKa = 4.27SDD69 pKa = 3.9GDD71 pKa = 4.33GIPDD75 pKa = 3.77TSDD78 pKa = 2.96ACPTQMEE85 pKa = 4.89TFNGYY90 pKa = 9.66QDD92 pKa = 3.74TDD94 pKa = 3.85GCPDD98 pKa = 3.77TAPVTTSPDD107 pKa = 3.01TDD109 pKa = 3.7ADD111 pKa = 4.63GIPDD115 pKa = 5.08DD116 pKa = 5.68KK117 pKa = 11.23DD118 pKa = 3.1ACPTQKK124 pKa = 9.23EE125 pKa = 4.57TVNGYY130 pKa = 10.29EE131 pKa = 5.19DD132 pKa = 5.55GDD134 pKa = 4.14GCPDD138 pKa = 3.8TVPPPTATDD147 pKa = 3.46TDD149 pKa = 4.06GDD151 pKa = 4.93GITDD155 pKa = 4.15DD156 pKa = 3.86QDD158 pKa = 3.6GCITQKK164 pKa = 9.41EE165 pKa = 4.59TVNGYY170 pKa = 10.2LDD172 pKa = 4.62NDD174 pKa = 4.29GCPDD178 pKa = 3.75TVPVVTEE185 pKa = 4.01PTTLPSSYY193 pKa = 10.37SLVMPPVSNQGGEE206 pKa = 4.41GSCVAFSVTYY216 pKa = 10.24ARR218 pKa = 11.84SYY220 pKa = 10.29EE221 pKa = 3.88QFKK224 pKa = 10.94RR225 pKa = 11.84SGATSYY231 pKa = 10.85SQSTNIMSPEE241 pKa = 3.85FVFNQIKK248 pKa = 10.59VDD250 pKa = 4.04VNCSASSLLSAYY262 pKa = 10.43DD263 pKa = 3.31FLVYY267 pKa = 10.72NGVCTWQSMPYY278 pKa = 8.89TSSNGCSLMPTTEE291 pKa = 4.07QLSEE295 pKa = 3.85ALNYY299 pKa = 9.61KK300 pKa = 9.73IKK302 pKa = 10.54AYY304 pKa = 10.6SQVLDD309 pKa = 3.77TDD311 pKa = 3.6ITAIKK316 pKa = 9.84QMIYY320 pKa = 10.81AKK322 pKa = 10.17RR323 pKa = 11.84PLVGQFSIDD332 pKa = 3.41DD333 pKa = 4.08GFRR336 pKa = 11.84TAGPGYY342 pKa = 9.19IWKK345 pKa = 8.72TLGSNTGLHH354 pKa = 5.69TLVICGYY361 pKa = 10.77DD362 pKa = 3.45DD363 pKa = 3.24TKK365 pKa = 11.34KK366 pKa = 10.73AFKK369 pKa = 10.54VLNSWGTGWGDD380 pKa = 3.53SGYY383 pKa = 11.25GWVDD387 pKa = 3.17YY388 pKa = 10.32TFLASVSSKK397 pKa = 10.66LLVMEE402 pKa = 4.96FF403 pKa = 3.59
MM1 pKa = 7.6LWTACQKK8 pKa = 10.17EE9 pKa = 4.35VSPEE13 pKa = 3.45ASIQNEE19 pKa = 4.05IEE21 pKa = 4.27SADD24 pKa = 3.66LRR26 pKa = 11.84LSGVLEE32 pKa = 4.19EE33 pKa = 6.15DD34 pKa = 3.3EE35 pKa = 4.61SHH37 pKa = 6.29WNIIPVISSQNTMLKK52 pKa = 10.09PATTGKK58 pKa = 9.43PGAGGKK64 pKa = 9.94VKK66 pKa = 10.79DD67 pKa = 4.27SDD69 pKa = 3.9GDD71 pKa = 4.33GIPDD75 pKa = 3.77TSDD78 pKa = 2.96ACPTQMEE85 pKa = 4.89TFNGYY90 pKa = 9.66QDD92 pKa = 3.74TDD94 pKa = 3.85GCPDD98 pKa = 3.77TAPVTTSPDD107 pKa = 3.01TDD109 pKa = 3.7ADD111 pKa = 4.63GIPDD115 pKa = 5.08DD116 pKa = 5.68KK117 pKa = 11.23DD118 pKa = 3.1ACPTQKK124 pKa = 9.23EE125 pKa = 4.57TVNGYY130 pKa = 10.29EE131 pKa = 5.19DD132 pKa = 5.55GDD134 pKa = 4.14GCPDD138 pKa = 3.8TVPPPTATDD147 pKa = 3.46TDD149 pKa = 4.06GDD151 pKa = 4.93GITDD155 pKa = 4.15DD156 pKa = 3.86QDD158 pKa = 3.6GCITQKK164 pKa = 9.41EE165 pKa = 4.59TVNGYY170 pKa = 10.2LDD172 pKa = 4.62NDD174 pKa = 4.29GCPDD178 pKa = 3.75TVPVVTEE185 pKa = 4.01PTTLPSSYY193 pKa = 10.37SLVMPPVSNQGGEE206 pKa = 4.41GSCVAFSVTYY216 pKa = 10.24ARR218 pKa = 11.84SYY220 pKa = 10.29EE221 pKa = 3.88QFKK224 pKa = 10.94RR225 pKa = 11.84SGATSYY231 pKa = 10.85SQSTNIMSPEE241 pKa = 3.85FVFNQIKK248 pKa = 10.59VDD250 pKa = 4.04VNCSASSLLSAYY262 pKa = 10.43DD263 pKa = 3.31FLVYY267 pKa = 10.72NGVCTWQSMPYY278 pKa = 8.89TSSNGCSLMPTTEE291 pKa = 4.07QLSEE295 pKa = 3.85ALNYY299 pKa = 9.61KK300 pKa = 9.73IKK302 pKa = 10.54AYY304 pKa = 10.6SQVLDD309 pKa = 3.77TDD311 pKa = 3.6ITAIKK316 pKa = 9.84QMIYY320 pKa = 10.81AKK322 pKa = 10.17RR323 pKa = 11.84PLVGQFSIDD332 pKa = 3.41DD333 pKa = 4.08GFRR336 pKa = 11.84TAGPGYY342 pKa = 9.19IWKK345 pKa = 8.72TLGSNTGLHH354 pKa = 5.69TLVICGYY361 pKa = 10.77DD362 pKa = 3.45DD363 pKa = 3.24TKK365 pKa = 11.34KK366 pKa = 10.73AFKK369 pKa = 10.54VLNSWGTGWGDD380 pKa = 3.53SGYY383 pKa = 11.25GWVDD387 pKa = 3.17YY388 pKa = 10.32TFLASVSSKK397 pKa = 10.66LLVMEE402 pKa = 4.96FF403 pKa = 3.59
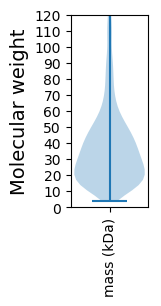
Molecular weight: 43.32 kDa
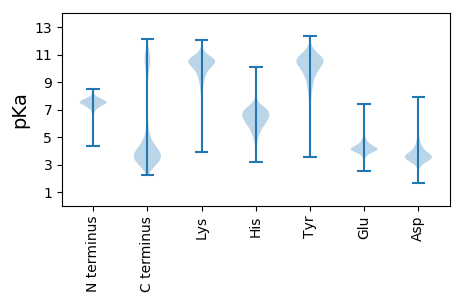
Isoelectric point according different methods:
Protein with the highest isoelectric point:
>tr|A0A0C1L2I2|A0A0C1L2I2_9BACT Uncharacterized protein OS=Flavihumibacter sp. ZG627 OX=1463156 GN=HY58_14830 PE=4 SV=1
MM1 pKa = 7.23MMTMVINSRR10 pKa = 11.84IIRR13 pKa = 11.84YY14 pKa = 8.73PLMAMVIMSVCAMMIDD30 pKa = 3.4IVVMPEE36 pKa = 3.58QGVMMMIDD44 pKa = 3.91AVPIKK49 pKa = 7.75TLRR52 pKa = 11.84MIRR55 pKa = 11.84RR56 pKa = 11.84GHH58 pKa = 5.89KK59 pKa = 10.15AIHH62 pKa = 6.03
MM1 pKa = 7.23MMTMVINSRR10 pKa = 11.84IIRR13 pKa = 11.84YY14 pKa = 8.73PLMAMVIMSVCAMMIDD30 pKa = 3.4IVVMPEE36 pKa = 3.58QGVMMMIDD44 pKa = 3.91AVPIKK49 pKa = 7.75TLRR52 pKa = 11.84MIRR55 pKa = 11.84RR56 pKa = 11.84GHH58 pKa = 5.89KK59 pKa = 10.15AIHH62 pKa = 6.03
Molecular weight: 7.15 kDa
Isoelectric point according different methods:
Peptides (in silico digests for buttom-up proteomics)
Below you can find in silico digests of the whole proteome with Trypsin, Chymotrypsin, Trypsin+LysC, LysN, ArgC proteases suitable for different mass spec machines.| Try ESI |
 |
|---|
| ChTry ESI |
 |
|---|
| ArgC ESI |
 |
|---|
| LysN ESI |
 |
|---|
| TryLysC ESI |
 |
|---|
| Try MALDI |
 |
|---|
| ChTry MALDI |
 |
|---|
| ArgC MALDI |
 |
|---|
| LysN MALDI |
 |
|---|
| TryLysC MALDI |
 |
|---|
| Try LTQ |
 |
|---|
| ChTry LTQ |
 |
|---|
| ArgC LTQ |
 |
|---|
| LysN LTQ |
 |
|---|
| TryLysC LTQ |
 |
|---|
| Try MSlow |
 |
|---|
| ChTry MSlow |
 |
|---|
| ArgC MSlow |
 |
|---|
| LysN MSlow |
 |
|---|
| TryLysC MSlow |
 |
|---|
| Try MShigh |
 |
|---|
| ChTry MShigh |
 |
|---|
| ArgC MShigh |
 |
|---|
| LysN MShigh |
 |
|---|
| TryLysC MShigh |
 |
|---|
General Statistics
Number of major isoforms |
Number of additional isoforms |
Number of all proteins |
Number of amino acids |
Min. Seq. Length |
Max. Seq. Length |
Avg. Seq. Length |
Avg. Mol. Weight |
|---|---|---|---|---|---|---|---|
0 |
1139701 |
35 |
2898 |
345.2 |
38.67 |
Amino acid frequency
Ala |
Cys |
Asp |
Glu |
Phe |
Gly |
His |
Ile |
Lys |
Leu |
|---|---|---|---|---|---|---|---|---|---|
7.627 ± 0.052 | 0.82 ± 0.018 |
5.263 ± 0.027 | 5.978 ± 0.044 |
4.791 ± 0.032 | 7.172 ± 0.043 |
1.959 ± 0.025 | 7.251 ± 0.033 |
6.343 ± 0.039 | 9.555 ± 0.046 |
Met |
Asn |
Gln |
Pro |
Arg |
Ser |
Thr |
Val |
Trp |
Tyr |
|---|---|---|---|---|---|---|---|---|---|
2.628 ± 0.02 | 5.183 ± 0.04 |
4.018 ± 0.023 | 3.668 ± 0.027 |
4.559 ± 0.029 | 6.414 ± 0.034 |
5.412 ± 0.036 | 6.271 ± 0.029 |
1.296 ± 0.019 | 3.792 ± 0.026 |
Most of the basic statistics you can see at this page can be downloaded from this CSV file
Proteome-pI is available under Creative Commons Attribution-NoDerivs license, for more details see here
| Reference: Kozlowski LP. Proteome-pI 2.0: Proteome Isoelectric Point Database Update. Nucleic Acids Res. 2021, doi: 10.1093/nar/gkab944 | Contact: Lukasz P. Kozlowski |
