Saccharicrinis fermentans DSM 9555 = JCM 21142
Taxonomy: cellular organisms; Bacteria; FCB group; Bacteroidetes/Chlorobi group; Bacteroidetes; Bacteroidia; Marinilabiliales; Marinilabiliaceae; Saccharicrinis; Saccharicrinis fermentans
Average proteome isoelectric point is 6.57
Get precalculated fractions of proteins

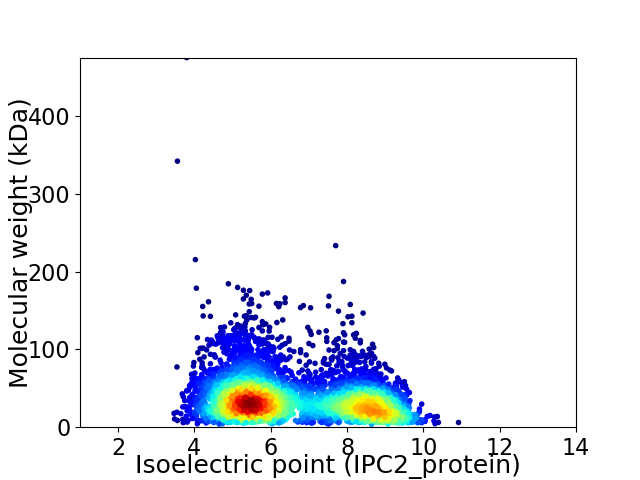
Virtual 2D-PAGE plot for 4663 proteins (isoelectric point calculated using IPC2_protein)
Get csv file with sequences according to given criteria:
* You can choose from 21 different methods for calculating isoelectric point
Summary statistics related to proteome-wise predictions


Protein with the lowest isoelectric point:
>tr|W7YMF9|W7YMF9_9BACT Uncharacterized protein OS=Saccharicrinis fermentans DSM 9555 = JCM 21142 OX=869213 GN=JCM21142_114612 PE=4 SV=1
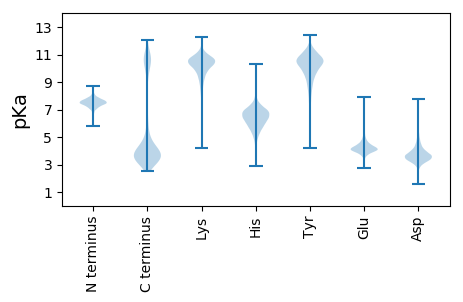
MM1 pKa = 7.62KK2 pKa = 10.49KK3 pKa = 10.32LLLFLGVMVLFKK15 pKa = 10.45LTSCDD20 pKa = 4.02VLDD23 pKa = 5.35DD24 pKa = 4.87DD25 pKa = 6.07SDD27 pKa = 4.28YY28 pKa = 11.88SLDD31 pKa = 3.78NFSLSSGTVLMDD43 pKa = 3.11VDD45 pKa = 4.46SYY47 pKa = 11.62SIKK50 pKa = 9.69TDD52 pKa = 3.0NGKK55 pKa = 9.22VLWPSASNVSVSLLEE70 pKa = 4.19DD71 pKa = 3.38SMRR74 pKa = 11.84VLVNYY79 pKa = 7.63TILGEE84 pKa = 4.19ATDD87 pKa = 4.0NDD89 pKa = 4.01SYY91 pKa = 11.85DD92 pKa = 3.35YY93 pKa = 10.56YY94 pKa = 11.68VRR96 pKa = 11.84VNGLSKK102 pKa = 10.65ILTKK106 pKa = 10.39PVFEE110 pKa = 4.63FTSEE114 pKa = 3.87TTADD118 pKa = 3.93VIDD121 pKa = 5.05SIGDD125 pKa = 3.62DD126 pKa = 3.29AVTIVDD132 pKa = 3.23TWFTDD137 pKa = 3.38DD138 pKa = 3.61YY139 pKa = 11.32LNVEE143 pKa = 4.48FEE145 pKa = 4.55YY146 pKa = 11.29GGGATVHH153 pKa = 6.19YY154 pKa = 9.99INLVFDD160 pKa = 4.51AEE162 pKa = 4.35NPTTEE167 pKa = 4.6DD168 pKa = 3.1GAIILEE174 pKa = 4.5LKK176 pKa = 10.03HH177 pKa = 5.85NHH179 pKa = 6.14NGDD182 pKa = 3.81PYY184 pKa = 11.51SYY186 pKa = 9.16LQWGIASFDD195 pKa = 3.32VSAFQTAEE203 pKa = 4.0KK204 pKa = 9.8DD205 pKa = 3.59TIDD208 pKa = 3.52FFVRR212 pKa = 11.84SKK214 pKa = 11.42GKK216 pKa = 10.38DD217 pKa = 2.83GAYY220 pKa = 10.49NYY222 pKa = 10.45NQVLTYY228 pKa = 10.14SYY230 pKa = 10.94GSASVEE236 pKa = 3.64EE237 pKa = 5.06SINKK241 pKa = 9.73QYY243 pKa = 9.96DD244 pKa = 3.78TEE246 pKa = 4.36NVSLLQSIQQ255 pKa = 3.06
MM1 pKa = 7.62KK2 pKa = 10.49KK3 pKa = 10.32LLLFLGVMVLFKK15 pKa = 10.45LTSCDD20 pKa = 4.02VLDD23 pKa = 5.35DD24 pKa = 4.87DD25 pKa = 6.07SDD27 pKa = 4.28YY28 pKa = 11.88SLDD31 pKa = 3.78NFSLSSGTVLMDD43 pKa = 3.11VDD45 pKa = 4.46SYY47 pKa = 11.62SIKK50 pKa = 9.69TDD52 pKa = 3.0NGKK55 pKa = 9.22VLWPSASNVSVSLLEE70 pKa = 4.19DD71 pKa = 3.38SMRR74 pKa = 11.84VLVNYY79 pKa = 7.63TILGEE84 pKa = 4.19ATDD87 pKa = 4.0NDD89 pKa = 4.01SYY91 pKa = 11.85DD92 pKa = 3.35YY93 pKa = 10.56YY94 pKa = 11.68VRR96 pKa = 11.84VNGLSKK102 pKa = 10.65ILTKK106 pKa = 10.39PVFEE110 pKa = 4.63FTSEE114 pKa = 3.87TTADD118 pKa = 3.93VIDD121 pKa = 5.05SIGDD125 pKa = 3.62DD126 pKa = 3.29AVTIVDD132 pKa = 3.23TWFTDD137 pKa = 3.38DD138 pKa = 3.61YY139 pKa = 11.32LNVEE143 pKa = 4.48FEE145 pKa = 4.55YY146 pKa = 11.29GGGATVHH153 pKa = 6.19YY154 pKa = 9.99INLVFDD160 pKa = 4.51AEE162 pKa = 4.35NPTTEE167 pKa = 4.6DD168 pKa = 3.1GAIILEE174 pKa = 4.5LKK176 pKa = 10.03HH177 pKa = 5.85NHH179 pKa = 6.14NGDD182 pKa = 3.81PYY184 pKa = 11.51SYY186 pKa = 9.16LQWGIASFDD195 pKa = 3.32VSAFQTAEE203 pKa = 4.0KK204 pKa = 9.8DD205 pKa = 3.59TIDD208 pKa = 3.52FFVRR212 pKa = 11.84SKK214 pKa = 11.42GKK216 pKa = 10.38DD217 pKa = 2.83GAYY220 pKa = 10.49NYY222 pKa = 10.45NQVLTYY228 pKa = 10.14SYY230 pKa = 10.94GSASVEE236 pKa = 3.64EE237 pKa = 5.06SINKK241 pKa = 9.73QYY243 pKa = 9.96DD244 pKa = 3.78TEE246 pKa = 4.36NVSLLQSIQQ255 pKa = 3.06
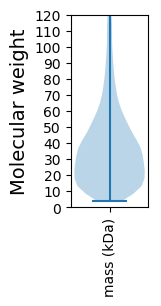
Molecular weight: 28.43 kDa
Isoelectric point according different methods:
Protein with the highest isoelectric point:
>tr|W7Y3L8|W7Y3L8_9BACT 50S ribosomal protein L3 OS=Saccharicrinis fermentans DSM 9555 = JCM 21142 OX=869213 GN=rplC PE=3 SV=1
MM1 pKa = 7.45KK2 pKa = 9.61RR3 pKa = 11.84TFQPSNRR10 pKa = 11.84KK11 pKa = 8.89RR12 pKa = 11.84RR13 pKa = 11.84NKK15 pKa = 9.84HH16 pKa = 3.75GFRR19 pKa = 11.84ARR21 pKa = 11.84MASANGRR28 pKa = 11.84KK29 pKa = 9.12VLASRR34 pKa = 11.84RR35 pKa = 11.84AKK37 pKa = 10.05GRR39 pKa = 11.84KK40 pKa = 8.34KK41 pKa = 10.71LSVSSEE47 pKa = 3.93KK48 pKa = 10.19RR49 pKa = 11.84HH50 pKa = 5.73KK51 pKa = 10.69AA52 pKa = 3.17
MM1 pKa = 7.45KK2 pKa = 9.61RR3 pKa = 11.84TFQPSNRR10 pKa = 11.84KK11 pKa = 8.89RR12 pKa = 11.84RR13 pKa = 11.84NKK15 pKa = 9.84HH16 pKa = 3.75GFRR19 pKa = 11.84ARR21 pKa = 11.84MASANGRR28 pKa = 11.84KK29 pKa = 9.12VLASRR34 pKa = 11.84RR35 pKa = 11.84AKK37 pKa = 10.05GRR39 pKa = 11.84KK40 pKa = 8.34KK41 pKa = 10.71LSVSSEE47 pKa = 3.93KK48 pKa = 10.19RR49 pKa = 11.84HH50 pKa = 5.73KK51 pKa = 10.69AA52 pKa = 3.17
Molecular weight: 6.06 kDa
Isoelectric point according different methods:
Peptides (in silico digests for buttom-up proteomics)
Below you can find in silico digests of the whole proteome with Trypsin, Chymotrypsin, Trypsin+LysC, LysN, ArgC proteases suitable for different mass spec machines.| Try ESI |
 |
|---|
| ChTry ESI |
 |
|---|
| ArgC ESI |
 |
|---|
| LysN ESI |
 |
|---|
| TryLysC ESI |
 |
|---|
| Try MALDI |
 |
|---|
| ChTry MALDI |
 |
|---|
| ArgC MALDI |
 |
|---|
| LysN MALDI |
 |
|---|
| TryLysC MALDI |
 |
|---|
| Try LTQ |
 |
|---|
| ChTry LTQ |
 |
|---|
| ArgC LTQ |
 |
|---|
| LysN LTQ |
 |
|---|
| TryLysC LTQ |
 |
|---|
| Try MSlow |
 |
|---|
| ChTry MSlow |
 |
|---|
| ArgC MSlow |
 |
|---|
| LysN MSlow |
 |
|---|
| TryLysC MSlow |
 |
|---|
| Try MShigh |
 |
|---|
| ChTry MShigh |
 |
|---|
| ArgC MShigh |
 |
|---|
| LysN MShigh |
 |
|---|
| TryLysC MShigh |
 |
|---|
General Statistics
Number of major isoforms |
Number of additional isoforms |
Number of all proteins |
Number of amino acids |
Min. Seq. Length |
Max. Seq. Length |
Avg. Seq. Length |
Avg. Mol. Weight |
|---|---|---|---|---|---|---|---|
0 |
1609379 |
34 |
4517 |
345.1 |
39.03 |
Amino acid frequency
Ala |
Cys |
Asp |
Glu |
Phe |
Gly |
His |
Ile |
Lys |
Leu |
|---|---|---|---|---|---|---|---|---|---|
6.241 ± 0.03 | 0.935 ± 0.014 |
5.722 ± 0.026 | 6.433 ± 0.035 |
4.867 ± 0.024 | 6.656 ± 0.04 |
2.041 ± 0.018 | 7.569 ± 0.034 |
7.429 ± 0.044 | 9.044 ± 0.04 |
Met |
Asn |
Gln |
Pro |
Arg |
Ser |
Thr |
Val |
Trp |
Tyr |
|---|---|---|---|---|---|---|---|---|---|
2.559 ± 0.017 | 5.74 ± 0.031 |
3.437 ± 0.02 | 3.503 ± 0.019 |
3.754 ± 0.023 | 6.706 ± 0.036 |
5.233 ± 0.033 | 6.461 ± 0.036 |
1.259 ± 0.015 | 4.411 ± 0.027 |
Most of the basic statistics you can see at this page can be downloaded from this CSV file
Proteome-pI is available under Creative Commons Attribution-NoDerivs license, for more details see here
| Reference: Kozlowski LP. Proteome-pI 2.0: Proteome Isoelectric Point Database Update. Nucleic Acids Res. 2021, doi: 10.1093/nar/gkab944 | Contact: Lukasz P. Kozlowski |
