Pontibacillus marinus BH030004 = DSM 16465
Taxonomy: cellular organisms; Bacteria; Terrabacteria group; Firmicutes; Bacilli; Bacillales; Bacillaceae; Pontibacillus; Pontibacillus marinus
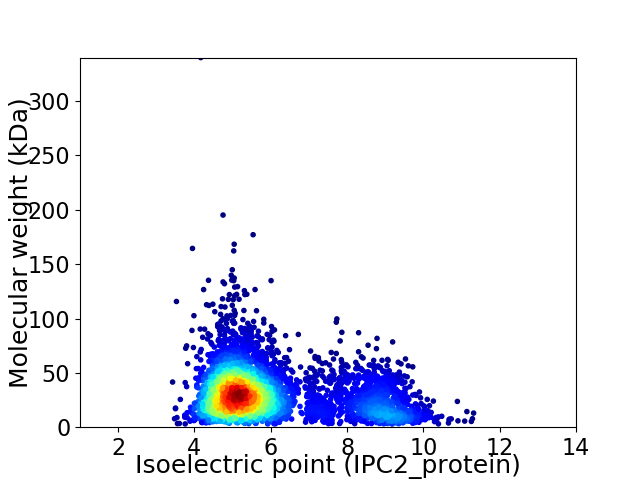
Average proteome isoelectric point is 5.98
Get precalculated fractions of proteins

Virtual 2D-PAGE plot for 4252 proteins (isoelectric point calculated using IPC2_protein)
Get csv file with sequences according to given criteria:
* You can choose from 21 different methods for calculating isoelectric point
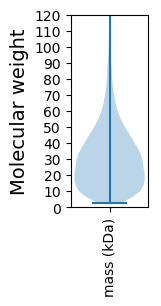
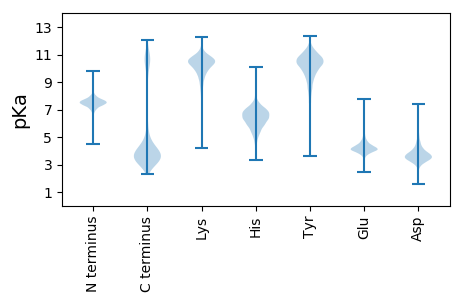
Summary statistics related to proteome-wise predictions


Protein with the lowest isoelectric point:
>tr|A0A0A5I139|A0A0A5I139_9BACI Uncharacterized protein OS=Pontibacillus marinus BH030004 = DSM 16465 OX=1385511 GN=N783_05610 PE=4 SV=1
TT1 pKa = 7.33GPTGPTGEE9 pKa = 4.61CVCLPRR15 pKa = 11.84YY16 pKa = 9.72CDD18 pKa = 4.46FYY20 pKa = 11.77FEE22 pKa = 4.36GTTINVAPNSSIPFNEE38 pKa = 4.13EE39 pKa = 4.02GEE41 pKa = 4.39CTEE44 pKa = 6.25DD45 pKa = 4.85DD46 pKa = 3.88FTPVNVMEE54 pKa = 4.57GTFTQIEE61 pKa = 4.49VEE63 pKa = 4.18HH64 pKa = 6.58EE65 pKa = 3.69GDD67 pKa = 3.56YY68 pKa = 11.05LINYY72 pKa = 8.16SVIFNNTPPTEE83 pKa = 4.05IVEE86 pKa = 4.37GAFALFVDD94 pKa = 4.81GLDD97 pKa = 3.33VDD99 pKa = 4.22ASRR102 pKa = 11.84FGEE105 pKa = 4.42TIVLASQPAGAQTKK119 pKa = 9.39IQVNGEE125 pKa = 4.37AIVHH129 pKa = 5.7IPEE132 pKa = 4.51GGILEE137 pKa = 4.57LRR139 pKa = 11.84NISNRR144 pKa = 11.84TVHH147 pKa = 5.87VLASVAGADD156 pKa = 3.44INGAAITIVQLDD168 pKa = 3.82NDD170 pKa = 4.47TVV172 pKa = 3.26
TT1 pKa = 7.33GPTGPTGEE9 pKa = 4.61CVCLPRR15 pKa = 11.84YY16 pKa = 9.72CDD18 pKa = 4.46FYY20 pKa = 11.77FEE22 pKa = 4.36GTTINVAPNSSIPFNEE38 pKa = 4.13EE39 pKa = 4.02GEE41 pKa = 4.39CTEE44 pKa = 6.25DD45 pKa = 4.85DD46 pKa = 3.88FTPVNVMEE54 pKa = 4.57GTFTQIEE61 pKa = 4.49VEE63 pKa = 4.18HH64 pKa = 6.58EE65 pKa = 3.69GDD67 pKa = 3.56YY68 pKa = 11.05LINYY72 pKa = 8.16SVIFNNTPPTEE83 pKa = 4.05IVEE86 pKa = 4.37GAFALFVDD94 pKa = 4.81GLDD97 pKa = 3.33VDD99 pKa = 4.22ASRR102 pKa = 11.84FGEE105 pKa = 4.42TIVLASQPAGAQTKK119 pKa = 9.39IQVNGEE125 pKa = 4.37AIVHH129 pKa = 5.7IPEE132 pKa = 4.51GGILEE137 pKa = 4.57LRR139 pKa = 11.84NISNRR144 pKa = 11.84TVHH147 pKa = 5.87VLASVAGADD156 pKa = 3.44INGAAITIVQLDD168 pKa = 3.82NDD170 pKa = 4.47TVV172 pKa = 3.26
Molecular weight: 18.37 kDa
Isoelectric point according different methods:
Protein with the highest isoelectric point:
>tr|A0A0A5FT77|A0A0A5FT77_9BACI ABC transporter substrate-binding protein OS=Pontibacillus marinus BH030004 = DSM 16465 OX=1385511 GN=N783_20170 PE=4 SV=1
GG1 pKa = 7.08GGGIFAWVRR10 pKa = 11.84AAFARR15 pKa = 11.84VRR17 pKa = 11.84SVFARR22 pKa = 11.84VRR24 pKa = 11.84AAFARR29 pKa = 11.84VRR31 pKa = 11.84AAFARR36 pKa = 11.84VRR38 pKa = 11.84GAFAWVRR45 pKa = 11.84SAFARR50 pKa = 11.84VRR52 pKa = 11.84AVFARR57 pKa = 11.84VRR59 pKa = 11.84AAFAQVQGAFARR71 pKa = 11.84VRR73 pKa = 11.84AAFARR78 pKa = 11.84VCAAFARR85 pKa = 11.84VRR87 pKa = 11.84AAFARR92 pKa = 11.84VRR94 pKa = 11.84AGFARR99 pKa = 11.84VRR101 pKa = 11.84AAFARR106 pKa = 11.84VRR108 pKa = 11.84SAFARR113 pKa = 11.84VRR115 pKa = 11.84TTFAA119 pKa = 3.75
GG1 pKa = 7.08GGGIFAWVRR10 pKa = 11.84AAFARR15 pKa = 11.84VRR17 pKa = 11.84SVFARR22 pKa = 11.84VRR24 pKa = 11.84AAFARR29 pKa = 11.84VRR31 pKa = 11.84AAFARR36 pKa = 11.84VRR38 pKa = 11.84GAFAWVRR45 pKa = 11.84SAFARR50 pKa = 11.84VRR52 pKa = 11.84AVFARR57 pKa = 11.84VRR59 pKa = 11.84AAFAQVQGAFARR71 pKa = 11.84VRR73 pKa = 11.84AAFARR78 pKa = 11.84VCAAFARR85 pKa = 11.84VRR87 pKa = 11.84AAFARR92 pKa = 11.84VRR94 pKa = 11.84AGFARR99 pKa = 11.84VRR101 pKa = 11.84AAFARR106 pKa = 11.84VRR108 pKa = 11.84SAFARR113 pKa = 11.84VRR115 pKa = 11.84TTFAA119 pKa = 3.75
Molecular weight: 13.0 kDa
Isoelectric point according different methods:
Peptides (in silico digests for buttom-up proteomics)
Below you can find in silico digests of the whole proteome with Trypsin, Chymotrypsin, Trypsin+LysC, LysN, ArgC proteases suitable for different mass spec machines.| Try ESI |
 |
|---|
| ChTry ESI |
 |
|---|
| ArgC ESI |
 |
|---|
| LysN ESI |
 |
|---|
| TryLysC ESI |
 |
|---|
| Try MALDI |
 |
|---|
| ChTry MALDI |
 |
|---|
| ArgC MALDI |
 |
|---|
| LysN MALDI |
 |
|---|
| TryLysC MALDI |
 |
|---|
| Try LTQ |
 |
|---|
| ChTry LTQ |
 |
|---|
| ArgC LTQ |
 |
|---|
| LysN LTQ |
 |
|---|
| TryLysC LTQ |
 |
|---|
| Try MSlow |
 |
|---|
| ChTry MSlow |
 |
|---|
| ArgC MSlow |
 |
|---|
| LysN MSlow |
 |
|---|
| TryLysC MSlow |
 |
|---|
| Try MShigh |
 |
|---|
| ChTry MShigh |
 |
|---|
| ArgC MShigh |
 |
|---|
| LysN MShigh |
 |
|---|
| TryLysC MShigh |
 |
|---|
General Statistics
Number of major isoforms |
Number of additional isoforms |
Number of all proteins |
Number of amino acids |
Min. Seq. Length |
Max. Seq. Length |
Avg. Seq. Length |
Avg. Mol. Weight |
|---|---|---|---|---|---|---|---|
0 |
1200615 |
26 |
3060 |
282.4 |
31.85 |
Amino acid frequency
Ala |
Cys |
Asp |
Glu |
Phe |
Gly |
His |
Ile |
Lys |
Leu |
|---|---|---|---|---|---|---|---|---|---|
6.345 ± 0.043 | 0.634 ± 0.012 |
5.557 ± 0.036 | 7.975 ± 0.042 |
4.507 ± 0.032 | 6.809 ± 0.037 |
2.274 ± 0.022 | 7.35 ± 0.043 |
6.674 ± 0.039 | 9.417 ± 0.043 |
Met |
Asn |
Gln |
Pro |
Arg |
Ser |
Thr |
Val |
Trp |
Tyr |
|---|---|---|---|---|---|---|---|---|---|
2.897 ± 0.018 | 4.505 ± 0.033 |
3.65 ± 0.021 | 4.252 ± 0.035 |
3.891 ± 0.028 | 6.176 ± 0.035 |
5.329 ± 0.03 | 7.014 ± 0.03 |
1.085 ± 0.015 | 3.658 ± 0.024 |
Most of the basic statistics you can see at this page can be downloaded from this CSV file
Proteome-pI is available under Creative Commons Attribution-NoDerivs license, for more details see here
| Reference: Kozlowski LP. Proteome-pI 2.0: Proteome Isoelectric Point Database Update. Nucleic Acids Res. 2021, doi: 10.1093/nar/gkab944 | Contact: Lukasz P. Kozlowski |
