Blastococcus sp. DSM 44272
Taxonomy: cellular organisms; Bacteria; Terrabacteria group; Actinobacteria; Actinomycetia; Geodermatophilales; Geodermatophilaceae; Blastococcus; unclassified Blastococcus
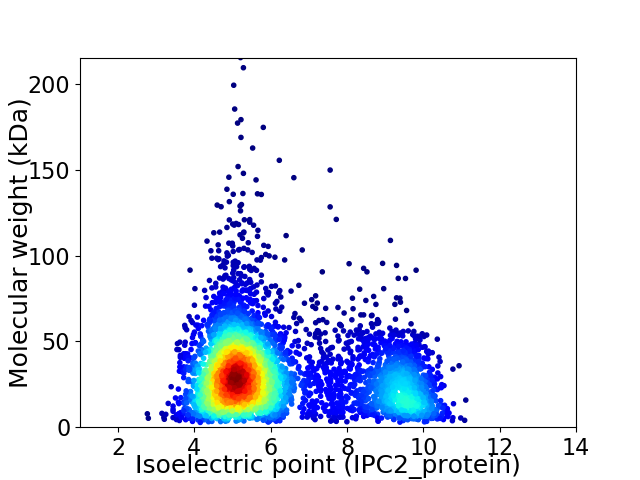
Average proteome isoelectric point is 6.23
Get precalculated fractions of proteins

Virtual 2D-PAGE plot for 4923 proteins (isoelectric point calculated using IPC2_protein)
Get csv file with sequences according to given criteria:
* You can choose from 21 different methods for calculating isoelectric point
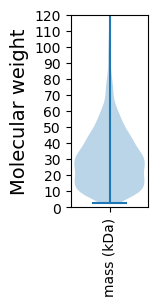
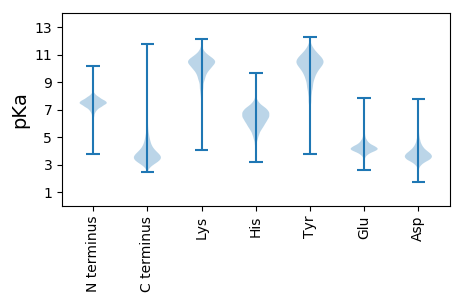
Summary statistics related to proteome-wise predictions


Protein with the lowest isoelectric point:
>tr|A0A238UNR6|A0A238UNR6_9ACTN Homogentisate 1 2-dioxygenase OS=Blastococcus sp. DSM 44272 OX=1938746 GN=SAMN06272737_101157 PE=3 SV=1
MM1 pKa = 7.31FLLRR5 pKa = 11.84PALVPLASVAVAVLLAGCGAQVEE28 pKa = 4.79DD29 pKa = 4.78PDD31 pKa = 4.65AAASPDD37 pKa = 3.58AAGTSAACDD46 pKa = 3.79DD47 pKa = 4.87PDD49 pKa = 4.07ISGDD53 pKa = 3.45PFAAPEE59 pKa = 4.09LTEE62 pKa = 5.09LEE64 pKa = 4.57ADD66 pKa = 3.74TEE68 pKa = 4.42LAGQVPDD75 pKa = 4.27TYY77 pKa = 10.84TEE79 pKa = 3.91QPLVIGVAPDD89 pKa = 3.88LPPINFGGEE98 pKa = 3.9DD99 pKa = 3.88GEE101 pKa = 4.4QRR103 pKa = 11.84GYY105 pKa = 10.77EE106 pKa = 4.01ADD108 pKa = 3.69LLRR111 pKa = 11.84AAGQLVGVEE120 pKa = 4.33IVFQEE125 pKa = 4.3SQNALQEE132 pKa = 4.2YY133 pKa = 10.3SAGQVDD139 pKa = 5.7GIAGAFTDD147 pKa = 3.46TLEE150 pKa = 4.11RR151 pKa = 11.84QKK153 pKa = 11.18LGDD156 pKa = 4.34FIDD159 pKa = 4.03YY160 pKa = 8.63STGSRR165 pKa = 11.84AALTQKK171 pKa = 10.33CNPKK175 pKa = 10.36GIEE178 pKa = 4.13STEE181 pKa = 4.07DD182 pKa = 3.23LCGLEE187 pKa = 4.24VVAAVGTVQLAQLTDD202 pKa = 3.54SEE204 pKa = 5.24TPGSLLTLCEE214 pKa = 4.18EE215 pKa = 4.84AGLPAPIPVQADD227 pKa = 3.6TSVSAITSLTAGRR240 pKa = 11.84AAAMVTGEE248 pKa = 4.55PIAVNAVKK256 pKa = 10.4QSEE259 pKa = 4.42GALTIAYY266 pKa = 9.81VEE268 pKa = 4.25EE269 pKa = 4.63LPVPVGVMISKK280 pKa = 9.25EE281 pKa = 4.16HH282 pKa = 6.79AEE284 pKa = 4.07LTAVLAQAYY293 pKa = 8.41QKK295 pKa = 11.05LVDD298 pKa = 4.57DD299 pKa = 4.4GTYY302 pKa = 10.85AEE304 pKa = 4.77IMNAYY309 pKa = 9.04GIEE312 pKa = 4.04YY313 pKa = 10.43GLLDD317 pKa = 4.63TITINGATSS326 pKa = 2.88
MM1 pKa = 7.31FLLRR5 pKa = 11.84PALVPLASVAVAVLLAGCGAQVEE28 pKa = 4.79DD29 pKa = 4.78PDD31 pKa = 4.65AAASPDD37 pKa = 3.58AAGTSAACDD46 pKa = 3.79DD47 pKa = 4.87PDD49 pKa = 4.07ISGDD53 pKa = 3.45PFAAPEE59 pKa = 4.09LTEE62 pKa = 5.09LEE64 pKa = 4.57ADD66 pKa = 3.74TEE68 pKa = 4.42LAGQVPDD75 pKa = 4.27TYY77 pKa = 10.84TEE79 pKa = 3.91QPLVIGVAPDD89 pKa = 3.88LPPINFGGEE98 pKa = 3.9DD99 pKa = 3.88GEE101 pKa = 4.4QRR103 pKa = 11.84GYY105 pKa = 10.77EE106 pKa = 4.01ADD108 pKa = 3.69LLRR111 pKa = 11.84AAGQLVGVEE120 pKa = 4.33IVFQEE125 pKa = 4.3SQNALQEE132 pKa = 4.2YY133 pKa = 10.3SAGQVDD139 pKa = 5.7GIAGAFTDD147 pKa = 3.46TLEE150 pKa = 4.11RR151 pKa = 11.84QKK153 pKa = 11.18LGDD156 pKa = 4.34FIDD159 pKa = 4.03YY160 pKa = 8.63STGSRR165 pKa = 11.84AALTQKK171 pKa = 10.33CNPKK175 pKa = 10.36GIEE178 pKa = 4.13STEE181 pKa = 4.07DD182 pKa = 3.23LCGLEE187 pKa = 4.24VVAAVGTVQLAQLTDD202 pKa = 3.54SEE204 pKa = 5.24TPGSLLTLCEE214 pKa = 4.18EE215 pKa = 4.84AGLPAPIPVQADD227 pKa = 3.6TSVSAITSLTAGRR240 pKa = 11.84AAAMVTGEE248 pKa = 4.55PIAVNAVKK256 pKa = 10.4QSEE259 pKa = 4.42GALTIAYY266 pKa = 9.81VEE268 pKa = 4.25EE269 pKa = 4.63LPVPVGVMISKK280 pKa = 9.25EE281 pKa = 4.16HH282 pKa = 6.79AEE284 pKa = 4.07LTAVLAQAYY293 pKa = 8.41QKK295 pKa = 11.05LVDD298 pKa = 4.57DD299 pKa = 4.4GTYY302 pKa = 10.85AEE304 pKa = 4.77IMNAYY309 pKa = 9.04GIEE312 pKa = 4.04YY313 pKa = 10.43GLLDD317 pKa = 4.63TITINGATSS326 pKa = 2.88
Molecular weight: 33.51 kDa
Isoelectric point according different methods:
Protein with the highest isoelectric point:
>tr|A0A238ZQI6|A0A238ZQI6_9ACTN Methyltransferase domain-containing protein OS=Blastococcus sp. DSM 44272 OX=1938746 GN=SAMN06272737_1322 PE=4 SV=1
MM1 pKa = 7.4GALPARR7 pKa = 11.84PLPVGPLPVPQLPAEE22 pKa = 4.42PLPAVPLPAVPLPAVPLPAVPLPAVPLPAVPLPVVHH58 pKa = 7.37RR59 pKa = 11.84LRR61 pKa = 11.84ARR63 pKa = 11.84GRR65 pKa = 11.84VRR67 pKa = 11.84ARR69 pKa = 11.84RR70 pKa = 11.84PVRR73 pKa = 11.84ATTPSAARR81 pKa = 11.84HH82 pKa = 4.57ARR84 pKa = 11.84RR85 pKa = 11.84RR86 pKa = 11.84PVARR90 pKa = 11.84LAPVRR95 pKa = 11.84PHH97 pKa = 6.73PALLARR103 pKa = 11.84VRR105 pKa = 11.84RR106 pKa = 11.84PAAPARR112 pKa = 11.84VRR114 pKa = 11.84ADD116 pKa = 3.69LVPLRR121 pKa = 11.84VPVVRR126 pKa = 11.84VRR128 pKa = 11.84LPVPAVPARR137 pKa = 11.84LPVPVVRR144 pKa = 11.84VPTRR148 pKa = 11.84GG149 pKa = 3.08
MM1 pKa = 7.4GALPARR7 pKa = 11.84PLPVGPLPVPQLPAEE22 pKa = 4.42PLPAVPLPAVPLPAVPLPAVPLPAVPLPAVPLPVVHH58 pKa = 7.37RR59 pKa = 11.84LRR61 pKa = 11.84ARR63 pKa = 11.84GRR65 pKa = 11.84VRR67 pKa = 11.84ARR69 pKa = 11.84RR70 pKa = 11.84PVRR73 pKa = 11.84ATTPSAARR81 pKa = 11.84HH82 pKa = 4.57ARR84 pKa = 11.84RR85 pKa = 11.84RR86 pKa = 11.84PVARR90 pKa = 11.84LAPVRR95 pKa = 11.84PHH97 pKa = 6.73PALLARR103 pKa = 11.84VRR105 pKa = 11.84RR106 pKa = 11.84PAAPARR112 pKa = 11.84VRR114 pKa = 11.84ADD116 pKa = 3.69LVPLRR121 pKa = 11.84VPVVRR126 pKa = 11.84VRR128 pKa = 11.84LPVPAVPARR137 pKa = 11.84LPVPVVRR144 pKa = 11.84VPTRR148 pKa = 11.84GG149 pKa = 3.08
Molecular weight: 15.81 kDa
Isoelectric point according different methods:
Peptides (in silico digests for buttom-up proteomics)
Below you can find in silico digests of the whole proteome with Trypsin, Chymotrypsin, Trypsin+LysC, LysN, ArgC proteases suitable for different mass spec machines.| Try ESI |
 |
|---|
| ChTry ESI |
 |
|---|
| ArgC ESI |
 |
|---|
| LysN ESI |
 |
|---|
| TryLysC ESI |
 |
|---|
| Try MALDI |
 |
|---|
| ChTry MALDI |
 |
|---|
| ArgC MALDI |
 |
|---|
| LysN MALDI |
 |
|---|
| TryLysC MALDI |
 |
|---|
| Try LTQ |
 |
|---|
| ChTry LTQ |
 |
|---|
| ArgC LTQ |
 |
|---|
| LysN LTQ |
 |
|---|
| TryLysC LTQ |
 |
|---|
| Try MSlow |
 |
|---|
| ChTry MSlow |
 |
|---|
| ArgC MSlow |
 |
|---|
| LysN MSlow |
 |
|---|
| TryLysC MSlow |
 |
|---|
| Try MShigh |
 |
|---|
| ChTry MShigh |
 |
|---|
| ArgC MShigh |
 |
|---|
| LysN MShigh |
 |
|---|
| TryLysC MShigh |
 |
|---|
General Statistics
Number of major isoforms |
Number of additional isoforms |
Number of all proteins |
Number of amino acids |
Min. Seq. Length |
Max. Seq. Length |
Avg. Seq. Length |
Avg. Mol. Weight |
|---|---|---|---|---|---|---|---|
0 |
1496879 |
25 |
2014 |
304.1 |
32.36 |
Amino acid frequency
Ala |
Cys |
Asp |
Glu |
Phe |
Gly |
His |
Ile |
Lys |
Leu |
|---|---|---|---|---|---|---|---|---|---|
14.008 ± 0.054 | 0.726 ± 0.009 |
6.155 ± 0.027 | 5.629 ± 0.035 |
2.613 ± 0.019 | 9.529 ± 0.037 |
2.075 ± 0.016 | 3.088 ± 0.023 |
1.471 ± 0.019 | 10.616 ± 0.039 |
Met |
Asn |
Gln |
Pro |
Arg |
Ser |
Thr |
Val |
Trp |
Tyr |
|---|---|---|---|---|---|---|---|---|---|
1.705 ± 0.011 | 1.535 ± 0.015 |
6.197 ± 0.029 | 2.746 ± 0.02 |
8.22 ± 0.041 | 4.988 ± 0.022 |
5.915 ± 0.024 | 9.514 ± 0.039 |
1.467 ± 0.015 | 1.803 ± 0.015 |
Most of the basic statistics you can see at this page can be downloaded from this CSV file
Proteome-pI is available under Creative Commons Attribution-NoDerivs license, for more details see here
| Reference: Kozlowski LP. Proteome-pI 2.0: Proteome Isoelectric Point Database Update. Nucleic Acids Res. 2021, doi: 10.1093/nar/gkab944 | Contact: Lukasz P. Kozlowski |
