Chryseobacterium sp. Leaf180
Taxonomy: cellular organisms; Bacteria; FCB group; Bacteroidetes/Chlorobi group; Bacteroidetes; Flavobacteriia; Flavobacteriales; Weeksellaceae; Chryseobacterium group; Chryseobacterium; unclassified Chryseobacterium
Average proteome isoelectric point is 6.74
Get precalculated fractions of proteins
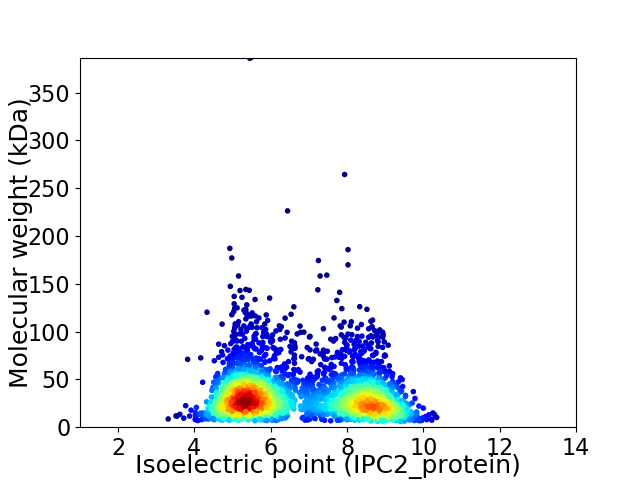
Virtual 2D-PAGE plot for 3021 proteins (isoelectric point calculated using IPC2_protein)
Get csv file with sequences according to given criteria:
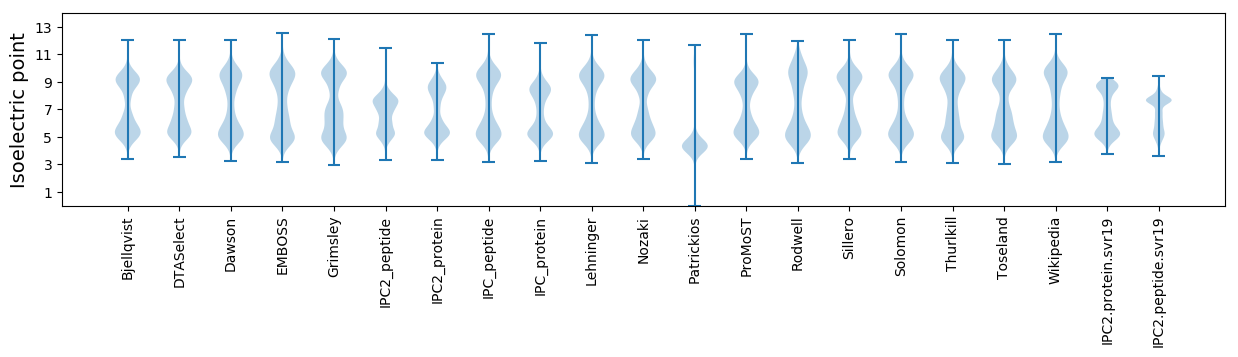
* You can choose from 21 different methods for calculating isoelectric point
Summary statistics related to proteome-wise predictions
Protein with the lowest isoelectric point:
>tr|A0A0Q5QNR1|A0A0Q5QNR1_9FLAO Uncharacterized protein OS=Chryseobacterium sp. Leaf180 OX=1736289 GN=ASG01_06475 PE=4 SV=1
MM1 pKa = 7.57KK2 pKa = 10.54GILKK6 pKa = 9.77IYY8 pKa = 10.07HH9 pKa = 6.63PEE11 pKa = 3.61EE12 pKa = 3.72TLKK15 pKa = 11.2YY16 pKa = 9.63NIKK19 pKa = 8.74NTYY22 pKa = 9.23CKK24 pKa = 10.18AVYY27 pKa = 10.47SNQQHH32 pKa = 5.37FLEE35 pKa = 4.81VEE37 pKa = 4.4VITDD41 pKa = 3.44EE42 pKa = 4.9SLDD45 pKa = 3.87HH46 pKa = 7.49VDD48 pKa = 6.01DD49 pKa = 6.88DD50 pKa = 4.44SLQYY54 pKa = 10.88NYY56 pKa = 9.76PQLAFKK62 pKa = 10.43IYY64 pKa = 10.13DD65 pKa = 3.56FPIEE69 pKa = 4.02SDD71 pKa = 3.68EE72 pKa = 4.74ISGKK76 pKa = 8.57TINVDD81 pKa = 3.4DD82 pKa = 4.56TVDD85 pKa = 3.8EE86 pKa = 5.12IYY88 pKa = 10.73TEE90 pKa = 4.32ADD92 pKa = 4.11LYY94 pKa = 11.42CDD96 pKa = 4.82DD97 pKa = 5.45DD98 pKa = 4.3AVLYY102 pKa = 10.56GSEE105 pKa = 5.39LIFSDD110 pKa = 5.54DD111 pKa = 3.59EE112 pKa = 4.32QGDD115 pKa = 3.88LQVIWKK121 pKa = 10.46GEE123 pKa = 3.53IDD125 pKa = 3.83DD126 pKa = 4.73FYY128 pKa = 11.11TRR130 pKa = 11.84SDD132 pKa = 3.38TPLPFRR138 pKa = 11.84LKK140 pKa = 10.74CSLKK144 pKa = 10.1PDD146 pKa = 4.24EE147 pKa = 4.52ILIDD151 pKa = 3.81EE152 pKa = 4.45EE153 pKa = 4.35
MM1 pKa = 7.57KK2 pKa = 10.54GILKK6 pKa = 9.77IYY8 pKa = 10.07HH9 pKa = 6.63PEE11 pKa = 3.61EE12 pKa = 3.72TLKK15 pKa = 11.2YY16 pKa = 9.63NIKK19 pKa = 8.74NTYY22 pKa = 9.23CKK24 pKa = 10.18AVYY27 pKa = 10.47SNQQHH32 pKa = 5.37FLEE35 pKa = 4.81VEE37 pKa = 4.4VITDD41 pKa = 3.44EE42 pKa = 4.9SLDD45 pKa = 3.87HH46 pKa = 7.49VDD48 pKa = 6.01DD49 pKa = 6.88DD50 pKa = 4.44SLQYY54 pKa = 10.88NYY56 pKa = 9.76PQLAFKK62 pKa = 10.43IYY64 pKa = 10.13DD65 pKa = 3.56FPIEE69 pKa = 4.02SDD71 pKa = 3.68EE72 pKa = 4.74ISGKK76 pKa = 8.57TINVDD81 pKa = 3.4DD82 pKa = 4.56TVDD85 pKa = 3.8EE86 pKa = 5.12IYY88 pKa = 10.73TEE90 pKa = 4.32ADD92 pKa = 4.11LYY94 pKa = 11.42CDD96 pKa = 4.82DD97 pKa = 5.45DD98 pKa = 4.3AVLYY102 pKa = 10.56GSEE105 pKa = 5.39LIFSDD110 pKa = 5.54DD111 pKa = 3.59EE112 pKa = 4.32QGDD115 pKa = 3.88LQVIWKK121 pKa = 10.46GEE123 pKa = 3.53IDD125 pKa = 3.83DD126 pKa = 4.73FYY128 pKa = 11.11TRR130 pKa = 11.84SDD132 pKa = 3.38TPLPFRR138 pKa = 11.84LKK140 pKa = 10.74CSLKK144 pKa = 10.1PDD146 pKa = 4.24EE147 pKa = 4.52ILIDD151 pKa = 3.81EE152 pKa = 4.45EE153 pKa = 4.35
Molecular weight: 17.84 kDa
Isoelectric point according different methods:
Protein with the highest isoelectric point:
>tr|A0A0Q5QJF5|A0A0Q5QJF5_9FLAO NodB homology domain-containing protein OS=Chryseobacterium sp. Leaf180 OX=1736289 GN=ASG01_08345 PE=4 SV=1
MM1 pKa = 7.49SIVHH5 pKa = 6.6KK6 pKa = 10.17IGRR9 pKa = 11.84RR10 pKa = 11.84KK11 pKa = 7.17TAVARR16 pKa = 11.84VYY18 pKa = 10.3VKK20 pKa = 10.5PGTGNITVNRR30 pKa = 11.84KK31 pKa = 8.29DD32 pKa = 3.26AKK34 pKa = 10.76VYY36 pKa = 10.16FSTDD40 pKa = 2.78VMVYY44 pKa = 10.08KK45 pKa = 10.68VNQPFILTEE54 pKa = 3.95TVGQYY59 pKa = 11.19DD60 pKa = 3.33VTVNVFGGGNTGQAEE75 pKa = 4.25AVRR78 pKa = 11.84LGISRR83 pKa = 11.84ALCEE87 pKa = 3.88INAEE91 pKa = 4.0YY92 pKa = 10.77RR93 pKa = 11.84LLLKK97 pKa = 10.65PEE99 pKa = 4.27GLLTRR104 pKa = 11.84DD105 pKa = 2.83ARR107 pKa = 11.84MVEE110 pKa = 4.26RR111 pKa = 11.84KK112 pKa = 9.98KK113 pKa = 10.51PGQKK117 pKa = 9.6KK118 pKa = 9.13ARR120 pKa = 11.84KK121 pKa = 8.69RR122 pKa = 11.84FQFSKK127 pKa = 10.78RR128 pKa = 3.42
MM1 pKa = 7.49SIVHH5 pKa = 6.6KK6 pKa = 10.17IGRR9 pKa = 11.84RR10 pKa = 11.84KK11 pKa = 7.17TAVARR16 pKa = 11.84VYY18 pKa = 10.3VKK20 pKa = 10.5PGTGNITVNRR30 pKa = 11.84KK31 pKa = 8.29DD32 pKa = 3.26AKK34 pKa = 10.76VYY36 pKa = 10.16FSTDD40 pKa = 2.78VMVYY44 pKa = 10.08KK45 pKa = 10.68VNQPFILTEE54 pKa = 3.95TVGQYY59 pKa = 11.19DD60 pKa = 3.33VTVNVFGGGNTGQAEE75 pKa = 4.25AVRR78 pKa = 11.84LGISRR83 pKa = 11.84ALCEE87 pKa = 3.88INAEE91 pKa = 4.0YY92 pKa = 10.77RR93 pKa = 11.84LLLKK97 pKa = 10.65PEE99 pKa = 4.27GLLTRR104 pKa = 11.84DD105 pKa = 2.83ARR107 pKa = 11.84MVEE110 pKa = 4.26RR111 pKa = 11.84KK112 pKa = 9.98KK113 pKa = 10.51PGQKK117 pKa = 9.6KK118 pKa = 9.13ARR120 pKa = 11.84KK121 pKa = 8.69RR122 pKa = 11.84FQFSKK127 pKa = 10.78RR128 pKa = 3.42
Molecular weight: 14.45 kDa
Isoelectric point according different methods:
Peptides (in silico digests for buttom-up proteomics)
Below you can find in silico digests of the whole proteome with Trypsin, Chymotrypsin, Trypsin+LysC, LysN, ArgC proteases suitable for different mass spec machines.| Try ESI |
 |
|---|
| ChTry ESI |
|
|---|
| ArgC ESI |
|
|---|
| LysN ESI |
|
|---|
| TryLysC ESI |
|
|---|
| Try MALDI |
|
|---|
| ChTry MALDI |
|
|---|
| ArgC MALDI |
|
|---|
| LysN MALDI |
|
|---|
| TryLysC MALDI |
|
|---|
| Try LTQ |
|
|---|
| ChTry LTQ |
|
|---|
| ArgC LTQ |
|
|---|
| LysN LTQ |
|
|---|
| TryLysC LTQ |
|
|---|
| Try MSlow |
|
|---|
| ChTry MSlow |
|
|---|
| ArgC MSlow |
|
|---|
| LysN MSlow |
|
|---|
| TryLysC MSlow |
|
|---|
| Try MShigh |
|
|---|
| ChTry MShigh |
|
|---|
| ArgC MShigh |
|
|---|
| LysN MShigh |
|
|---|
| TryLysC MShigh |
|
|---|
General Statistics
Number of major isoforms |
Number of additional isoforms |
Number of all proteins |
Number of amino acids |
Min. Seq. Length |
Max. Seq. Length |
Avg. Seq. Length |
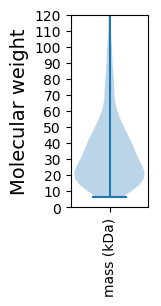
Avg. Mol. Weight |
|---|---|---|---|---|---|---|---|
0 |
980680 |
55 |
3488 |
324.6 |
36.67 |
Amino acid frequency
Ala |
Cys |
Asp |
Glu |
Phe |
Gly |
His |
Ile |
Lys |
Leu |
|---|---|---|---|---|---|---|---|---|---|
6.519 ± 0.043 | 0.746 ± 0.014 |
5.448 ± 0.036 | 6.535 ± 0.058 |
5.598 ± 0.033 | 6.292 ± 0.045 |
1.649 ± 0.021 | 7.733 ± 0.043 |
8.148 ± 0.061 | 8.924 ± 0.045 |
Met |
Asn |
Gln |
Pro |
Arg |
Ser |
Thr |
Val |
Trp |
Tyr |
|---|---|---|---|---|---|---|---|---|---|
2.382 ± 0.022 | 6.217 ± 0.044 |
3.43 ± 0.027 | 3.504 ± 0.025 |
3.463 ± 0.031 | 6.669 ± 0.04 |
5.638 ± 0.059 | 6.086 ± 0.032 |
1.004 ± 0.015 | 4.011 ± 0.033 |
Most of the basic statistics you can see at this page can be downloaded from this CSV file
See this proteome in:

Proteome-pI is available under Creative Commons Attribution-NoDerivs license, for more details see here
| Reference: Kozlowski LP. Proteome-pI 2.0: Proteome Isoelectric Point Database Update. Nucleic Acids Res. 2021, doi: 10.1093/nar/gkab944 | Contact: Lukasz P. Kozlowski |