Marinobacter profundi
Taxonomy: cellular organisms; Bacteria; Proteobacteria; Gammaproteobacteria; Alteromonadales; Alteromonadaceae; Marinobacter
Average proteome isoelectric point is 6.1
Get precalculated fractions of proteins

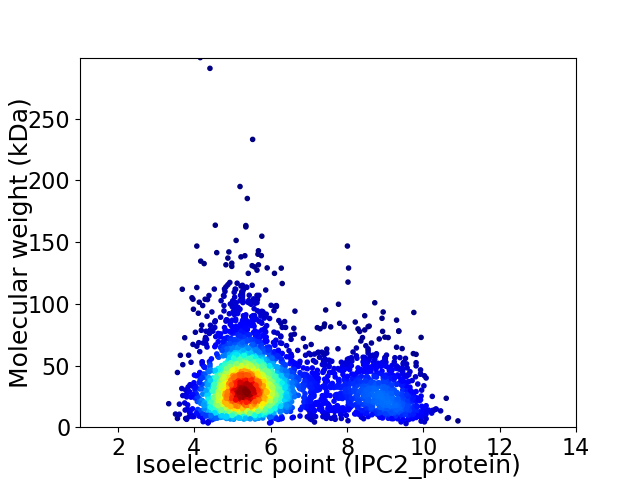
Virtual 2D-PAGE plot for 3568 proteins (isoelectric point calculated using IPC2_protein)
Get csv file with sequences according to given criteria:
* You can choose from 21 different methods for calculating isoelectric point
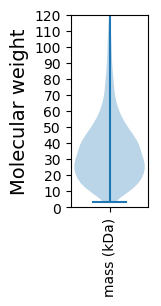
Summary statistics related to proteome-wise predictions


Protein with the lowest isoelectric point:
>tr|A0A2G1UJV0|A0A2G1UJV0_9ALTE AraC family transcriptional regulator OS=Marinobacter profundi OX=2666256 GN=CLH61_12760 PE=4 SV=1
MM1 pKa = 7.24NNSLKK6 pKa = 10.53FLTVTALAASLAACGGDD23 pKa = 3.6GGDD26 pKa = 3.81SQATGTLSLGITDD39 pKa = 4.49APVDD43 pKa = 3.68EE44 pKa = 4.9LKK46 pKa = 10.73EE47 pKa = 4.06VNITVTGVEE56 pKa = 4.23IKK58 pKa = 9.96PASGEE63 pKa = 3.84SRR65 pKa = 11.84RR66 pKa = 11.84YY67 pKa = 10.36DD68 pKa = 3.47FEE70 pKa = 4.63EE71 pKa = 4.33PLALDD76 pKa = 4.35LLALQGGNAALLLNDD91 pKa = 3.94EE92 pKa = 4.59EE93 pKa = 4.91VPAGEE98 pKa = 4.4YY99 pKa = 10.09NWVRR103 pKa = 11.84LYY105 pKa = 10.65ISTEE109 pKa = 3.87PGEE112 pKa = 4.18LTAVDD117 pKa = 4.14MNGGVHH123 pKa = 7.26DD124 pKa = 5.19LYY126 pKa = 10.67IPSGAQTGLKK136 pKa = 9.49LVSGFTVPAGGDD148 pKa = 3.09ADD150 pKa = 3.81FTIDD154 pKa = 3.3FDD156 pKa = 4.05VRR158 pKa = 11.84KK159 pKa = 10.36SIVDD163 pKa = 3.59PQGSNPSGAEE173 pKa = 3.9YY174 pKa = 10.27FLKK177 pKa = 10.55PALRR181 pKa = 11.84LIDD184 pKa = 3.71NVEE187 pKa = 4.14AGTISGTVDD196 pKa = 2.85GTLIAEE202 pKa = 4.79ACTDD206 pKa = 3.25AATFDD211 pKa = 3.5GGVYY215 pKa = 9.52VHH217 pKa = 7.0TGADD221 pKa = 3.61QVPDD225 pKa = 4.05DD226 pKa = 4.86LGSTNEE232 pKa = 4.14PLVIAPVAFDD242 pKa = 3.41GTAYY246 pKa = 10.66SYY248 pKa = 9.63TAAFISAGNYY258 pKa = 6.41TVSYY262 pKa = 9.8TCDD265 pKa = 3.54LDD267 pKa = 3.66TRR269 pKa = 11.84EE270 pKa = 4.4DD271 pKa = 3.83ANGEE275 pKa = 4.1LVDD278 pKa = 5.06EE279 pKa = 4.65EE280 pKa = 4.49LTFYY284 pKa = 9.3GTQNVTVVADD294 pKa = 3.8TTTTADD300 pKa = 3.39FF301 pKa = 4.42
MM1 pKa = 7.24NNSLKK6 pKa = 10.53FLTVTALAASLAACGGDD23 pKa = 3.6GGDD26 pKa = 3.81SQATGTLSLGITDD39 pKa = 4.49APVDD43 pKa = 3.68EE44 pKa = 4.9LKK46 pKa = 10.73EE47 pKa = 4.06VNITVTGVEE56 pKa = 4.23IKK58 pKa = 9.96PASGEE63 pKa = 3.84SRR65 pKa = 11.84RR66 pKa = 11.84YY67 pKa = 10.36DD68 pKa = 3.47FEE70 pKa = 4.63EE71 pKa = 4.33PLALDD76 pKa = 4.35LLALQGGNAALLLNDD91 pKa = 3.94EE92 pKa = 4.59EE93 pKa = 4.91VPAGEE98 pKa = 4.4YY99 pKa = 10.09NWVRR103 pKa = 11.84LYY105 pKa = 10.65ISTEE109 pKa = 3.87PGEE112 pKa = 4.18LTAVDD117 pKa = 4.14MNGGVHH123 pKa = 7.26DD124 pKa = 5.19LYY126 pKa = 10.67IPSGAQTGLKK136 pKa = 9.49LVSGFTVPAGGDD148 pKa = 3.09ADD150 pKa = 3.81FTIDD154 pKa = 3.3FDD156 pKa = 4.05VRR158 pKa = 11.84KK159 pKa = 10.36SIVDD163 pKa = 3.59PQGSNPSGAEE173 pKa = 3.9YY174 pKa = 10.27FLKK177 pKa = 10.55PALRR181 pKa = 11.84LIDD184 pKa = 3.71NVEE187 pKa = 4.14AGTISGTVDD196 pKa = 2.85GTLIAEE202 pKa = 4.79ACTDD206 pKa = 3.25AATFDD211 pKa = 3.5GGVYY215 pKa = 9.52VHH217 pKa = 7.0TGADD221 pKa = 3.61QVPDD225 pKa = 4.05DD226 pKa = 4.86LGSTNEE232 pKa = 4.14PLVIAPVAFDD242 pKa = 3.41GTAYY246 pKa = 10.66SYY248 pKa = 9.63TAAFISAGNYY258 pKa = 6.41TVSYY262 pKa = 9.8TCDD265 pKa = 3.54LDD267 pKa = 3.66TRR269 pKa = 11.84EE270 pKa = 4.4DD271 pKa = 3.83ANGEE275 pKa = 4.1LVDD278 pKa = 5.06EE279 pKa = 4.65EE280 pKa = 4.49LTFYY284 pKa = 9.3GTQNVTVVADD294 pKa = 3.8TTTTADD300 pKa = 3.39FF301 pKa = 4.42
Molecular weight: 31.34 kDa
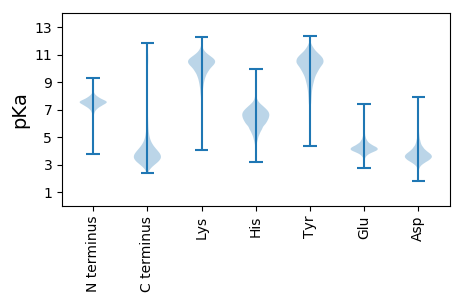
Isoelectric point according different methods:
Protein with the highest isoelectric point:
>tr|A0A2G1ULI0|A0A2G1ULI0_9ALTE Branched-chain amino acid ABC transporter permease OS=Marinobacter profundi OX=2666256 GN=CLH61_09520 PE=4 SV=1
MM1 pKa = 7.45KK2 pKa = 9.51RR3 pKa = 11.84TFQPSVLKK11 pKa = 10.34RR12 pKa = 11.84KK13 pKa = 9.1RR14 pKa = 11.84VHH16 pKa = 6.26GFRR19 pKa = 11.84ARR21 pKa = 11.84MATANGRR28 pKa = 11.84KK29 pKa = 8.93VLARR33 pKa = 11.84RR34 pKa = 11.84RR35 pKa = 11.84AKK37 pKa = 10.42GRR39 pKa = 11.84ARR41 pKa = 11.84LCAA44 pKa = 3.92
MM1 pKa = 7.45KK2 pKa = 9.51RR3 pKa = 11.84TFQPSVLKK11 pKa = 10.34RR12 pKa = 11.84KK13 pKa = 9.1RR14 pKa = 11.84VHH16 pKa = 6.26GFRR19 pKa = 11.84ARR21 pKa = 11.84MATANGRR28 pKa = 11.84KK29 pKa = 8.93VLARR33 pKa = 11.84RR34 pKa = 11.84RR35 pKa = 11.84AKK37 pKa = 10.42GRR39 pKa = 11.84ARR41 pKa = 11.84LCAA44 pKa = 3.92
Molecular weight: 5.11 kDa
Isoelectric point according different methods:
Peptides (in silico digests for buttom-up proteomics)
Below you can find in silico digests of the whole proteome with Trypsin, Chymotrypsin, Trypsin+LysC, LysN, ArgC proteases suitable for different mass spec machines.| Try ESI |
 |
|---|
| ChTry ESI |
 |
|---|
| ArgC ESI |
 |
|---|
| LysN ESI |
 |
|---|
| TryLysC ESI |
 |
|---|
| Try MALDI |
 |
|---|
| ChTry MALDI |
 |
|---|
| ArgC MALDI |
 |
|---|
| LysN MALDI |
 |
|---|
| TryLysC MALDI |
 |
|---|
| Try LTQ |
 |
|---|
| ChTry LTQ |
 |
|---|
| ArgC LTQ |
 |
|---|
| LysN LTQ |
 |
|---|
| TryLysC LTQ |
 |
|---|
| Try MSlow |
 |
|---|
| ChTry MSlow |
 |
|---|
| ArgC MSlow |
 |
|---|
| LysN MSlow |
 |
|---|
| TryLysC MSlow |
 |
|---|
| Try MShigh |
 |
|---|
| ChTry MShigh |
 |
|---|
| ArgC MShigh |
 |
|---|
| LysN MShigh |
 |
|---|
| TryLysC MShigh |
 |
|---|
General Statistics
Number of major isoforms |
Number of additional isoforms |
Number of all proteins |
Number of amino acids |
Min. Seq. Length |
Max. Seq. Length |
Avg. Seq. Length |
Avg. Mol. Weight |
|---|---|---|---|---|---|---|---|
0 |
1209230 |
26 |
2800 |
338.9 |
37.24 |
Amino acid frequency
Ala |
Cys |
Asp |
Glu |
Phe |
Gly |
His |
Ile |
Lys |
Leu |
|---|---|---|---|---|---|---|---|---|---|
10.489 ± 0.043 | 0.945 ± 0.012 |
5.748 ± 0.036 | 6.221 ± 0.042 |
3.72 ± 0.025 | 8.178 ± 0.042 |
2.207 ± 0.018 | 5.083 ± 0.031 |
3.188 ± 0.034 | 10.922 ± 0.053 |
Met |
Asn |
Gln |
Pro |
Arg |
Ser |
Thr |
Val |
Trp |
Tyr |
|---|---|---|---|---|---|---|---|---|---|
2.507 ± 0.019 | 3.037 ± 0.026 |
4.822 ± 0.024 | 3.91 ± 0.028 |
6.807 ± 0.041 | 5.606 ± 0.028 |
5.177 ± 0.03 | 7.457 ± 0.036 |
1.395 ± 0.016 | 2.583 ± 0.022 |
Most of the basic statistics you can see at this page can be downloaded from this CSV file
Proteome-pI is available under Creative Commons Attribution-NoDerivs license, for more details see here
| Reference: Kozlowski LP. Proteome-pI 2.0: Proteome Isoelectric Point Database Update. Nucleic Acids Res. 2021, doi: 10.1093/nar/gkab944 | Contact: Lukasz P. Kozlowski |
