Devosia epidermidihirudinis
Taxonomy: cellular organisms; Bacteria; Proteobacteria; Alphaproteobacteria; Hyphomicrobiales; Devosiaceae; Devosia
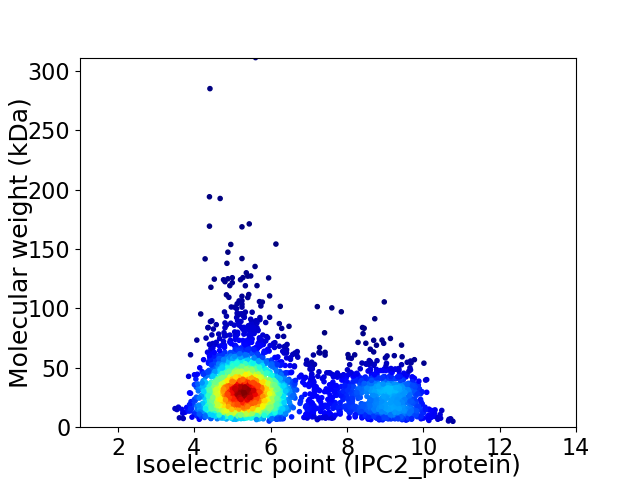
Average proteome isoelectric point is 6.21
Get precalculated fractions of proteins

Virtual 2D-PAGE plot for 3353 proteins (isoelectric point calculated using IPC2_protein)
Get csv file with sequences according to given criteria:
* You can choose from 21 different methods for calculating isoelectric point
Summary statistics related to proteome-wise predictions


Protein with the lowest isoelectric point:
>tr|A0A0F5Q3M8|A0A0F5Q3M8_9RHIZ Alanine--tRNA ligase OS=Devosia epidermidihirudinis OX=1293439 GN=alaS PE=3 SV=1
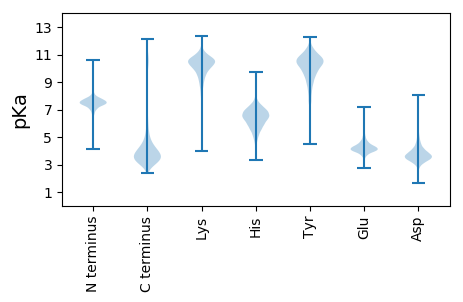
MM1 pKa = 7.76AISPTDD7 pKa = 2.71WGTRR11 pKa = 11.84YY12 pKa = 10.46APTLDD17 pKa = 5.03DD18 pKa = 4.03IEE20 pKa = 5.22GLASQALKK28 pKa = 10.64DD29 pKa = 3.7LPEE32 pKa = 4.41PFRR35 pKa = 11.84SLAADD40 pKa = 3.86VTCSVADD47 pKa = 3.7YY48 pKa = 11.22AEE50 pKa = 4.09EE51 pKa = 5.82DD52 pKa = 3.37ILASFGMEE60 pKa = 4.23SPFEE64 pKa = 3.98LMGLFSGIGMTEE76 pKa = 4.33DD77 pKa = 3.09GAMPQTGQLPNTVYY91 pKa = 10.78LYY93 pKa = 10.82RR94 pKa = 11.84RR95 pKa = 11.84AILDD99 pKa = 3.21YY100 pKa = 10.2WAEE103 pKa = 4.11HH104 pKa = 7.43DD105 pKa = 5.11DD106 pKa = 3.79NTLGEE111 pKa = 4.62VVTHH115 pKa = 5.82VLIHH119 pKa = 5.98EE120 pKa = 5.08LGHH123 pKa = 6.39HH124 pKa = 6.58FGFSDD129 pKa = 3.6EE130 pKa = 4.25DD131 pKa = 3.62MEE133 pKa = 6.46AIEE136 pKa = 4.75SSADD140 pKa = 3.36EE141 pKa = 4.32SS142 pKa = 3.89
MM1 pKa = 7.76AISPTDD7 pKa = 2.71WGTRR11 pKa = 11.84YY12 pKa = 10.46APTLDD17 pKa = 5.03DD18 pKa = 4.03IEE20 pKa = 5.22GLASQALKK28 pKa = 10.64DD29 pKa = 3.7LPEE32 pKa = 4.41PFRR35 pKa = 11.84SLAADD40 pKa = 3.86VTCSVADD47 pKa = 3.7YY48 pKa = 11.22AEE50 pKa = 4.09EE51 pKa = 5.82DD52 pKa = 3.37ILASFGMEE60 pKa = 4.23SPFEE64 pKa = 3.98LMGLFSGIGMTEE76 pKa = 4.33DD77 pKa = 3.09GAMPQTGQLPNTVYY91 pKa = 10.78LYY93 pKa = 10.82RR94 pKa = 11.84RR95 pKa = 11.84AILDD99 pKa = 3.21YY100 pKa = 10.2WAEE103 pKa = 4.11HH104 pKa = 7.43DD105 pKa = 5.11DD106 pKa = 3.79NTLGEE111 pKa = 4.62VVTHH115 pKa = 5.82VLIHH119 pKa = 5.98EE120 pKa = 5.08LGHH123 pKa = 6.39HH124 pKa = 6.58FGFSDD129 pKa = 3.6EE130 pKa = 4.25DD131 pKa = 3.62MEE133 pKa = 6.46AIEE136 pKa = 4.75SSADD140 pKa = 3.36EE141 pKa = 4.32SS142 pKa = 3.89
Molecular weight: 15.59 kDa
Isoelectric point according different methods:
Protein with the highest isoelectric point:
>tr|A0A0F5QBT7|A0A0F5QBT7_9RHIZ Multidrug ABC transporter OS=Devosia epidermidihirudinis OX=1293439 GN=WH87_11225 PE=3 SV=1
MM1 pKa = 7.21SVWIGAVMVGAVFFTSTLSGIFGMAGGLILLAILLSIMPVGTAIAVQGAIQIISNGSRR59 pKa = 11.84AFLSRR64 pKa = 11.84AFIDD68 pKa = 3.26WRR70 pKa = 11.84VLGTICLGLLTAGILLFILRR90 pKa = 11.84YY91 pKa = 7.24TPSLATVCIVIGLMPILVWIPRR113 pKa = 11.84DD114 pKa = 3.42WLALDD119 pKa = 3.66ASKK122 pKa = 10.37PLHH125 pKa = 6.55AFICGFVGGGLNLAVGVSGPTIDD148 pKa = 3.41IFFIRR153 pKa = 11.84TPMDD157 pKa = 2.86RR158 pKa = 11.84RR159 pKa = 11.84KK160 pKa = 9.85IVATKK165 pKa = 10.38AATQVISHH173 pKa = 6.24GAKK176 pKa = 9.94VVFYY180 pKa = 9.86WNATMVLTPGEE191 pKa = 4.24WIAVLIAAPFAIGGANVGFWVLQRR215 pKa = 11.84LSDD218 pKa = 3.89ANFKK222 pKa = 10.44RR223 pKa = 11.84WTRR226 pKa = 11.84WIVTAVGIFYY236 pKa = 9.58MSRR239 pKa = 11.84GISLAFGAA247 pKa = 5.05
MM1 pKa = 7.21SVWIGAVMVGAVFFTSTLSGIFGMAGGLILLAILLSIMPVGTAIAVQGAIQIISNGSRR59 pKa = 11.84AFLSRR64 pKa = 11.84AFIDD68 pKa = 3.26WRR70 pKa = 11.84VLGTICLGLLTAGILLFILRR90 pKa = 11.84YY91 pKa = 7.24TPSLATVCIVIGLMPILVWIPRR113 pKa = 11.84DD114 pKa = 3.42WLALDD119 pKa = 3.66ASKK122 pKa = 10.37PLHH125 pKa = 6.55AFICGFVGGGLNLAVGVSGPTIDD148 pKa = 3.41IFFIRR153 pKa = 11.84TPMDD157 pKa = 2.86RR158 pKa = 11.84RR159 pKa = 11.84KK160 pKa = 9.85IVATKK165 pKa = 10.38AATQVISHH173 pKa = 6.24GAKK176 pKa = 9.94VVFYY180 pKa = 9.86WNATMVLTPGEE191 pKa = 4.24WIAVLIAAPFAIGGANVGFWVLQRR215 pKa = 11.84LSDD218 pKa = 3.89ANFKK222 pKa = 10.44RR223 pKa = 11.84WTRR226 pKa = 11.84WIVTAVGIFYY236 pKa = 9.58MSRR239 pKa = 11.84GISLAFGAA247 pKa = 5.05
Molecular weight: 26.42 kDa
Isoelectric point according different methods:
Peptides (in silico digests for buttom-up proteomics)
Below you can find in silico digests of the whole proteome with Trypsin, Chymotrypsin, Trypsin+LysC, LysN, ArgC proteases suitable for different mass spec machines.| Try ESI |
 |
|---|
| ChTry ESI |
 |
|---|
| ArgC ESI |
 |
|---|
| LysN ESI |
 |
|---|
| TryLysC ESI |
 |
|---|
| Try MALDI |
 |
|---|
| ChTry MALDI |
 |
|---|
| ArgC MALDI |
 |
|---|
| LysN MALDI |
 |
|---|
| TryLysC MALDI |
 |
|---|
| Try LTQ |
 |
|---|
| ChTry LTQ |
 |
|---|
| ArgC LTQ |
 |
|---|
| LysN LTQ |
 |
|---|
| TryLysC LTQ |
 |
|---|
| Try MSlow |
 |
|---|
| ChTry MSlow |
 |
|---|
| ArgC MSlow |
 |
|---|
| LysN MSlow |
 |
|---|
| TryLysC MSlow |
 |
|---|
| Try MShigh |
 |
|---|
| ChTry MShigh |
 |
|---|
| ArgC MShigh |
 |
|---|
| LysN MShigh |
 |
|---|
| TryLysC MShigh |
 |
|---|
General Statistics
Number of major isoforms |
Number of additional isoforms |
Number of all proteins |
Number of amino acids |
Min. Seq. Length |
Max. Seq. Length |
Avg. Seq. Length |
Avg. Mol. Weight |
|---|---|---|---|---|---|---|---|
0 |
1031883 |
41 |
2833 |
307.7 |
33.3 |
Amino acid frequency
Ala |
Cys |
Asp |
Glu |
Phe |
Gly |
His |
Ile |
Lys |
Leu |
|---|---|---|---|---|---|---|---|---|---|
12.187 ± 0.055 | 0.64 ± 0.01 |
5.804 ± 0.036 | 5.406 ± 0.041 |
3.859 ± 0.027 | 8.537 ± 0.042 |
1.957 ± 0.019 | 5.694 ± 0.03 |
3.352 ± 0.032 | 10.301 ± 0.049 |
Met |
Asn |
Gln |
Pro |
Arg |
Ser |
Thr |
Val |
Trp |
Tyr |
|---|---|---|---|---|---|---|---|---|---|
2.512 ± 0.02 | 2.925 ± 0.029 |
4.891 ± 0.032 | 3.209 ± 0.023 |
6.151 ± 0.043 | 5.571 ± 0.029 |
5.652 ± 0.035 | 7.722 ± 0.035 |
1.319 ± 0.018 | 2.314 ± 0.022 |
Most of the basic statistics you can see at this page can be downloaded from this CSV file
Proteome-pI is available under Creative Commons Attribution-NoDerivs license, for more details see here
| Reference: Kozlowski LP. Proteome-pI 2.0: Proteome Isoelectric Point Database Update. Nucleic Acids Res. 2021, doi: 10.1093/nar/gkab944 | Contact: Lukasz P. Kozlowski |
