Microbacterium phage Jayden
Taxonomy: Viruses; Duplodnaviria; Heunggongvirae; Uroviricota; Caudoviricetes; Caudovirales; Siphoviridae; Metamorphoovirus; unclassified Metamorphoovirus
Average proteome isoelectric point is 5.84
Get precalculated fractions of proteins

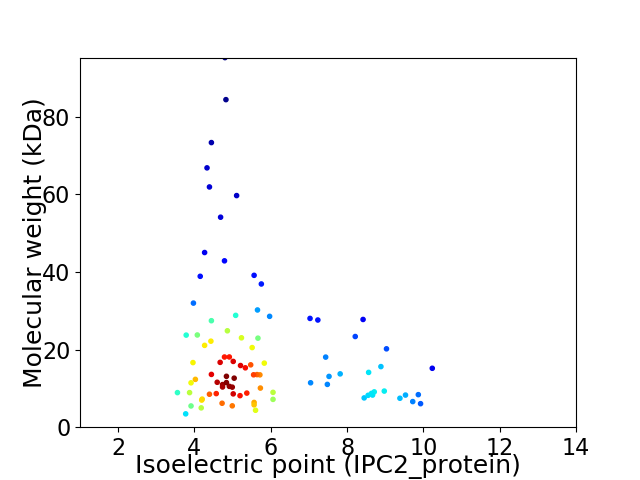
Virtual 2D-PAGE plot for 92 proteins (isoelectric point calculated using IPC2_protein)
Get csv file with sequences according to given criteria:
* You can choose from 21 different methods for calculating isoelectric point
Summary statistics related to proteome-wise predictions


Protein with the lowest isoelectric point:
>tr|A0A649VTJ4|A0A649VTJ4_9CAUD Uncharacterized protein OS=Microbacterium phage Jayden OX=2656550 GN=29 PE=4 SV=1
MM1 pKa = 7.17LTDD4 pKa = 4.31DD5 pKa = 4.71AAATSAAAFVVPTDD19 pKa = 3.7PPVTQACGWPVVYY32 pKa = 10.41LDD34 pKa = 5.48CADD37 pKa = 5.05DD38 pKa = 4.36DD39 pKa = 4.28CAAYY43 pKa = 10.4SQFPEE48 pKa = 4.3DD49 pKa = 3.36QQAAAQAWFEE59 pKa = 4.02AQAIDD64 pKa = 4.48ILWNATNGVFGVCDD78 pKa = 3.54VEE80 pKa = 5.31IRR82 pKa = 11.84PCRR85 pKa = 11.84QGCEE89 pKa = 4.48SNFDD93 pKa = 3.31WATTFWGRR101 pKa = 11.84GPGFSPGFPRR111 pKa = 11.84LGVGGAGGSFYY122 pKa = 10.48PVLVSGQWYY131 pKa = 9.81NVTCGCLGACQCSPSGPNVLSLPGPVVAVTEE162 pKa = 4.17VTIDD166 pKa = 3.62GLVVDD171 pKa = 4.8PATYY175 pKa = 10.33RR176 pKa = 11.84IDD178 pKa = 3.31RR179 pKa = 11.84GRR181 pKa = 11.84WLIRR185 pKa = 11.84DD186 pKa = 3.76GDD188 pKa = 4.31EE189 pKa = 4.36PWPGCQDD196 pKa = 3.28MNVPADD202 pKa = 3.58AVGSFVVRR210 pKa = 11.84YY211 pKa = 7.45TRR213 pKa = 11.84GIPVPAGGQIAAGRR227 pKa = 11.84LACEE231 pKa = 4.43LAMAACGDD239 pKa = 4.45DD240 pKa = 5.29DD241 pKa = 5.82CALPDD246 pKa = 3.18NWQTITRR253 pKa = 11.84QGLTVNADD261 pKa = 3.34PNMDD265 pKa = 3.55GTQVTGIWSIDD276 pKa = 3.07EE277 pKa = 4.27WIKK280 pKa = 10.35QVNRR284 pKa = 11.84PRR286 pKa = 11.84SFASVRR292 pKa = 11.84SVDD295 pKa = 4.24LPNLRR300 pKa = 4.34
MM1 pKa = 7.17LTDD4 pKa = 4.31DD5 pKa = 4.71AAATSAAAFVVPTDD19 pKa = 3.7PPVTQACGWPVVYY32 pKa = 10.41LDD34 pKa = 5.48CADD37 pKa = 5.05DD38 pKa = 4.36DD39 pKa = 4.28CAAYY43 pKa = 10.4SQFPEE48 pKa = 4.3DD49 pKa = 3.36QQAAAQAWFEE59 pKa = 4.02AQAIDD64 pKa = 4.48ILWNATNGVFGVCDD78 pKa = 3.54VEE80 pKa = 5.31IRR82 pKa = 11.84PCRR85 pKa = 11.84QGCEE89 pKa = 4.48SNFDD93 pKa = 3.31WATTFWGRR101 pKa = 11.84GPGFSPGFPRR111 pKa = 11.84LGVGGAGGSFYY122 pKa = 10.48PVLVSGQWYY131 pKa = 9.81NVTCGCLGACQCSPSGPNVLSLPGPVVAVTEE162 pKa = 4.17VTIDD166 pKa = 3.62GLVVDD171 pKa = 4.8PATYY175 pKa = 10.33RR176 pKa = 11.84IDD178 pKa = 3.31RR179 pKa = 11.84GRR181 pKa = 11.84WLIRR185 pKa = 11.84DD186 pKa = 3.76GDD188 pKa = 4.31EE189 pKa = 4.36PWPGCQDD196 pKa = 3.28MNVPADD202 pKa = 3.58AVGSFVVRR210 pKa = 11.84YY211 pKa = 7.45TRR213 pKa = 11.84GIPVPAGGQIAAGRR227 pKa = 11.84LACEE231 pKa = 4.43LAMAACGDD239 pKa = 4.45DD240 pKa = 5.29DD241 pKa = 5.82CALPDD246 pKa = 3.18NWQTITRR253 pKa = 11.84QGLTVNADD261 pKa = 3.34PNMDD265 pKa = 3.55GTQVTGIWSIDD276 pKa = 3.07EE277 pKa = 4.27WIKK280 pKa = 10.35QVNRR284 pKa = 11.84PRR286 pKa = 11.84SFASVRR292 pKa = 11.84SVDD295 pKa = 4.24LPNLRR300 pKa = 4.34
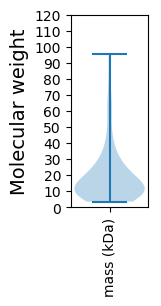
Molecular weight: 31.96 kDa
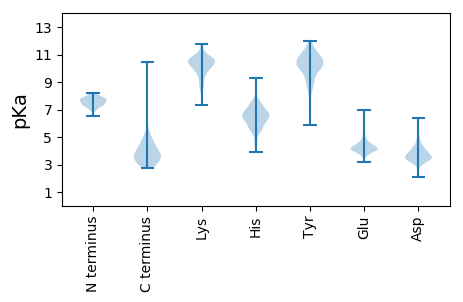
Isoelectric point according different methods:
Protein with the highest isoelectric point:
>tr|A0A649VSR4|A0A649VSR4_9CAUD Uncharacterized protein OS=Microbacterium phage Jayden OX=2656550 GN=34 PE=4 SV=1
MM1 pKa = 7.8TITTTTIPEE10 pKa = 4.03PVLEE14 pKa = 4.19VGRR17 pKa = 11.84AFEE20 pKa = 4.08KK21 pKa = 10.46RR22 pKa = 11.84RR23 pKa = 11.84EE24 pKa = 3.9IAQRR28 pKa = 11.84LADD31 pKa = 3.53QDD33 pKa = 3.98RR34 pKa = 11.84YY35 pKa = 10.52IGAAVRR41 pKa = 11.84TARR44 pKa = 11.84KK45 pKa = 9.49AGHH48 pKa = 6.06SWAEE52 pKa = 3.73MARR55 pKa = 11.84AAKK58 pKa = 10.32VSDD61 pKa = 3.6VAILKK66 pKa = 9.57AARR69 pKa = 11.84RR70 pKa = 11.84PEE72 pKa = 3.85KK73 pKa = 10.61AAA75 pKa = 3.79
MM1 pKa = 7.8TITTTTIPEE10 pKa = 4.03PVLEE14 pKa = 4.19VGRR17 pKa = 11.84AFEE20 pKa = 4.08KK21 pKa = 10.46RR22 pKa = 11.84RR23 pKa = 11.84EE24 pKa = 3.9IAQRR28 pKa = 11.84LADD31 pKa = 3.53QDD33 pKa = 3.98RR34 pKa = 11.84YY35 pKa = 10.52IGAAVRR41 pKa = 11.84TARR44 pKa = 11.84KK45 pKa = 9.49AGHH48 pKa = 6.06SWAEE52 pKa = 3.73MARR55 pKa = 11.84AAKK58 pKa = 10.32VSDD61 pKa = 3.6VAILKK66 pKa = 9.57AARR69 pKa = 11.84RR70 pKa = 11.84PEE72 pKa = 3.85KK73 pKa = 10.61AAA75 pKa = 3.79
Molecular weight: 8.27 kDa
Isoelectric point according different methods:
Peptides (in silico digests for buttom-up proteomics)
Below you can find in silico digests of the whole proteome with Trypsin, Chymotrypsin, Trypsin+LysC, LysN, ArgC proteases suitable for different mass spec machines.| Try ESI |
 |
|---|
| ChTry ESI |
 |
|---|
| ArgC ESI |
 |
|---|
| LysN ESI |
 |
|---|
| TryLysC ESI |
 |
|---|
| Try MALDI |
 |
|---|
| ChTry MALDI |
 |
|---|
| ArgC MALDI |
 |
|---|
| LysN MALDI |
 |
|---|
| TryLysC MALDI |
 |
|---|
| Try LTQ |
 |
|---|
| ChTry LTQ |
 |
|---|
| ArgC LTQ |
 |
|---|
| LysN LTQ |
 |
|---|
| TryLysC LTQ |
 |
|---|
| Try MSlow |
 |
|---|
| ChTry MSlow |
 |
|---|
| ArgC MSlow |
 |
|---|
| LysN MSlow |
 |
|---|
| TryLysC MSlow |
 |
|---|
| Try MShigh |
 |
|---|
| ChTry MShigh |
 |
|---|
| ArgC MShigh |
 |
|---|
| LysN MShigh |
 |
|---|
| TryLysC MShigh |
 |
|---|
General Statistics
Number of major isoforms |
Number of additional isoforms |
Number of all proteins |
Number of amino acids |
Min. Seq. Length |
Max. Seq. Length |
Avg. Seq. Length |
Avg. Mol. Weight |
|---|---|---|---|---|---|---|---|
0 |
16792 |
29 |
955 |
182.5 |
19.74 |
Amino acid frequency
Ala |
Cys |
Asp |
Glu |
Phe |
Gly |
His |
Ile |
Lys |
Leu |
|---|---|---|---|---|---|---|---|---|---|
12.083 ± 0.404 | 0.923 ± 0.136 |
6.557 ± 0.335 | 6.539 ± 0.386 |
2.686 ± 0.115 | 8.802 ± 0.373 |
1.846 ± 0.193 | 4.413 ± 0.248 |
2.579 ± 0.227 | 7.462 ± 0.358 |
Met |
Asn |
Gln |
Pro |
Arg |
Ser |
Thr |
Val |
Trp |
Tyr |
|---|---|---|---|---|---|---|---|---|---|
2.406 ± 0.156 | 2.555 ± 0.172 |
6.122 ± 0.267 | 3.013 ± 0.188 |
6.712 ± 0.387 | 6.164 ± 0.264 |
6.908 ± 0.366 | 7.641 ± 0.274 |
2.078 ± 0.156 | 2.513 ± 0.178 |
Most of the basic statistics you can see at this page can be downloaded from this CSV file
Proteome-pI is available under Creative Commons Attribution-NoDerivs license, for more details see here
| Reference: Kozlowski LP. Proteome-pI 2.0: Proteome Isoelectric Point Database Update. Nucleic Acids Res. 2021, doi: 10.1093/nar/gkab944 | Contact: Lukasz P. Kozlowski |
