Hop latent virus
Taxonomy: Viruses; Riboviria; Orthornavirae; Kitrinoviricota; Alsuviricetes; Tymovirales; Betaflexiviridae; Quinvirinae; Carlavirus
Average proteome isoelectric point is 7.01
Get precalculated fractions of proteins

Virtual 2D-PAGE plot for 6 proteins (isoelectric point calculated using IPC2_protein)
Get csv file with sequences according to given criteria:
* You can choose from 21 different methods for calculating isoelectric point
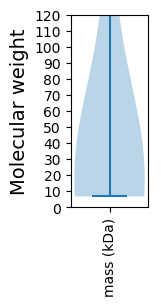
Summary statistics related to proteome-wise predictions


Protein with the lowest isoelectric point:
>tr|Q9E9R6|Q9E9R6_9VIRU Helicase OS=Hop latent virus OX=104263 GN=ORF 1 PE=2 SV=1
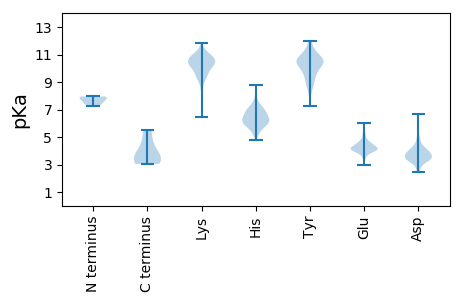
MM1 pKa = 7.86DD2 pKa = 3.94VLVDD6 pKa = 4.35LLHH9 pKa = 6.65KK10 pKa = 10.75FGFEE14 pKa = 3.96RR15 pKa = 11.84LSSRR19 pKa = 11.84LTTPIVVHH27 pKa = 6.13CVPGAGKK34 pKa = 8.46STLIRR39 pKa = 11.84EE40 pKa = 4.43LLDD43 pKa = 3.98LDD45 pKa = 4.22TRR47 pKa = 11.84FCAYY51 pKa = 8.71TAGVPDD57 pKa = 3.87SPRR60 pKa = 11.84LNGRR64 pKa = 11.84WIRR67 pKa = 11.84ALEE70 pKa = 4.29EE71 pKa = 4.17YY72 pKa = 10.13PGTEE76 pKa = 3.54GRR78 pKa = 11.84LAIVDD83 pKa = 4.46EE84 pKa = 4.28YY85 pKa = 11.44TLLDD89 pKa = 4.03KK90 pKa = 11.46LPFEE94 pKa = 4.63PFAVFGDD101 pKa = 4.69PIQSNSKK108 pKa = 10.26GVLPAHH114 pKa = 6.18FTCNFSRR121 pKa = 11.84RR122 pKa = 11.84FGLATSNLLRR132 pKa = 11.84DD133 pKa = 4.13LGWNVIAEE141 pKa = 4.42GSDD144 pKa = 3.29VVQISDD150 pKa = 3.19IFGVEE155 pKa = 4.17PIGTVVYY162 pKa = 9.49FEE164 pKa = 5.38AEE166 pKa = 4.27VGCLLRR172 pKa = 11.84SHH174 pKa = 6.51CVEE177 pKa = 4.08AKK179 pKa = 10.09SLAEE183 pKa = 3.76IRR185 pKa = 11.84GQTFDD190 pKa = 2.77IVTFVTSEE198 pKa = 3.98NCPSSDD204 pKa = 2.85VCAAFQCLTRR214 pKa = 11.84HH215 pKa = 6.06RR216 pKa = 11.84EE217 pKa = 3.98ALHH220 pKa = 5.88ILCPNATYY228 pKa = 8.9TAAA231 pKa = 4.37
MM1 pKa = 7.86DD2 pKa = 3.94VLVDD6 pKa = 4.35LLHH9 pKa = 6.65KK10 pKa = 10.75FGFEE14 pKa = 3.96RR15 pKa = 11.84LSSRR19 pKa = 11.84LTTPIVVHH27 pKa = 6.13CVPGAGKK34 pKa = 8.46STLIRR39 pKa = 11.84EE40 pKa = 4.43LLDD43 pKa = 3.98LDD45 pKa = 4.22TRR47 pKa = 11.84FCAYY51 pKa = 8.71TAGVPDD57 pKa = 3.87SPRR60 pKa = 11.84LNGRR64 pKa = 11.84WIRR67 pKa = 11.84ALEE70 pKa = 4.29EE71 pKa = 4.17YY72 pKa = 10.13PGTEE76 pKa = 3.54GRR78 pKa = 11.84LAIVDD83 pKa = 4.46EE84 pKa = 4.28YY85 pKa = 11.44TLLDD89 pKa = 4.03KK90 pKa = 11.46LPFEE94 pKa = 4.63PFAVFGDD101 pKa = 4.69PIQSNSKK108 pKa = 10.26GVLPAHH114 pKa = 6.18FTCNFSRR121 pKa = 11.84RR122 pKa = 11.84FGLATSNLLRR132 pKa = 11.84DD133 pKa = 4.13LGWNVIAEE141 pKa = 4.42GSDD144 pKa = 3.29VVQISDD150 pKa = 3.19IFGVEE155 pKa = 4.17PIGTVVYY162 pKa = 9.49FEE164 pKa = 5.38AEE166 pKa = 4.27VGCLLRR172 pKa = 11.84SHH174 pKa = 6.51CVEE177 pKa = 4.08AKK179 pKa = 10.09SLAEE183 pKa = 3.76IRR185 pKa = 11.84GQTFDD190 pKa = 2.77IVTFVTSEE198 pKa = 3.98NCPSSDD204 pKa = 2.85VCAAFQCLTRR214 pKa = 11.84HH215 pKa = 6.06RR216 pKa = 11.84EE217 pKa = 3.98ALHH220 pKa = 5.88ILCPNATYY228 pKa = 8.9TAAA231 pKa = 4.37
Molecular weight: 25.44 kDa
Isoelectric point according different methods:
Protein with the highest isoelectric point:
>tr|Q9E9R2|Q9E9R2_9VIRU Capsid protein OS=Hop latent virus OX=104263 GN=ORF 5 PE=2 SV=1
MM1 pKa = 7.5FYY3 pKa = 11.05LRR5 pKa = 11.84VALLLHH11 pKa = 6.31NKK13 pKa = 9.38FLEE16 pKa = 4.04QCGRR20 pKa = 11.84SDD22 pKa = 3.29FHH24 pKa = 8.21LCVMISLQVHH34 pKa = 5.73RR35 pKa = 11.84PVGVGRR41 pKa = 11.84SSYY44 pKa = 10.59ARR46 pKa = 11.84RR47 pKa = 11.84RR48 pKa = 11.84RR49 pKa = 11.84AKK51 pKa = 10.48LVGRR55 pKa = 11.84CHH57 pKa = 5.96RR58 pKa = 11.84CYY60 pKa = 10.69RR61 pKa = 11.84LWPPTAFTTRR71 pKa = 11.84CDD73 pKa = 3.54NKK75 pKa = 9.85TCFPGLTYY83 pKa = 10.4NASIARR89 pKa = 11.84FIRR92 pKa = 11.84DD93 pKa = 3.03GVTEE97 pKa = 4.74VIPSAPNN104 pKa = 3.05
MM1 pKa = 7.5FYY3 pKa = 11.05LRR5 pKa = 11.84VALLLHH11 pKa = 6.31NKK13 pKa = 9.38FLEE16 pKa = 4.04QCGRR20 pKa = 11.84SDD22 pKa = 3.29FHH24 pKa = 8.21LCVMISLQVHH34 pKa = 5.73RR35 pKa = 11.84PVGVGRR41 pKa = 11.84SSYY44 pKa = 10.59ARR46 pKa = 11.84RR47 pKa = 11.84RR48 pKa = 11.84RR49 pKa = 11.84AKK51 pKa = 10.48LVGRR55 pKa = 11.84CHH57 pKa = 5.96RR58 pKa = 11.84CYY60 pKa = 10.69RR61 pKa = 11.84LWPPTAFTTRR71 pKa = 11.84CDD73 pKa = 3.54NKK75 pKa = 9.85TCFPGLTYY83 pKa = 10.4NASIARR89 pKa = 11.84FIRR92 pKa = 11.84DD93 pKa = 3.03GVTEE97 pKa = 4.74VIPSAPNN104 pKa = 3.05
Molecular weight: 11.99 kDa
Isoelectric point according different methods:
Peptides (in silico digests for buttom-up proteomics)
Below you can find in silico digests of the whole proteome with Trypsin, Chymotrypsin, Trypsin+LysC, LysN, ArgC proteases suitable for different mass spec machines.| Try ESI |
 |
|---|
| ChTry ESI |
 |
|---|
| ArgC ESI |
 |
|---|
| LysN ESI |
 |
|---|
| TryLysC ESI |
 |
|---|
| Try MALDI |
 |
|---|
| ChTry MALDI |
 |
|---|
| ArgC MALDI |
 |
|---|
| LysN MALDI |
 |
|---|
| TryLysC MALDI |
 |
|---|
| Try LTQ |
 |
|---|
| ChTry LTQ |
 |
|---|
| ArgC LTQ |
 |
|---|
| LysN LTQ |
 |
|---|
| TryLysC LTQ |
 |
|---|
| Try MSlow |
 |
|---|
| ChTry MSlow |
 |
|---|
| ArgC MSlow |
 |
|---|
| LysN MSlow |
 |
|---|
| TryLysC MSlow |
 |
|---|
| Try MShigh |
 |
|---|
| ChTry MShigh |
 |
|---|
| ArgC MShigh |
 |
|---|
| LysN MShigh |
 |
|---|
| TryLysC MShigh |
 |
|---|
General Statistics
Number of major isoforms |
Number of additional isoforms |
Number of all proteins |
Number of amino acids |
Min. Seq. Length |
Max. Seq. Length |
Avg. Seq. Length |
Avg. Mol. Weight |
|---|---|---|---|---|---|---|---|
0 |
2790 |
60 |
1981 |
465.0 |
52.38 |
Amino acid frequency
Ala |
Cys |
Asp |
Glu |
Phe |
Gly |
His |
Ile |
Lys |
Leu |
|---|---|---|---|---|---|---|---|---|---|
7.814 ± 0.43 | 2.903 ± 0.566 |
5.09 ± 0.671 | 6.703 ± 1.025 |
4.695 ± 0.829 | 6.093 ± 0.584 |
2.473 ± 0.42 | 4.194 ± 0.267 |
5.806 ± 1.055 | 11.075 ± 0.748 |
Met |
Asn |
Gln |
Pro |
Arg |
Ser |
Thr |
Val |
Trp |
Tyr |
|---|---|---|---|---|---|---|---|---|---|
1.971 ± 0.419 | 3.943 ± 0.515 |
4.301 ± 0.791 | 3.011 ± 0.367 |
6.667 ± 0.726 | 6.953 ± 0.324 |
4.194 ± 0.624 | 7.563 ± 0.796 |
1.29 ± 0.128 | 3.262 ± 0.382 |
Most of the basic statistics you can see at this page can be downloaded from this CSV file
Proteome-pI is available under Creative Commons Attribution-NoDerivs license, for more details see here
| Reference: Kozlowski LP. Proteome-pI 2.0: Proteome Isoelectric Point Database Update. Nucleic Acids Res. 2021, doi: 10.1093/nar/gkab944 | Contact: Lukasz P. Kozlowski |
