Macaque stool associated virus 11
Taxonomy: Viruses; Monodnaviria; Shotokuvirae; Cressdnaviricota; Arfiviricetes; Cremevirales; Smacoviridae; Porprismacovirus; Porprismacovirus macas5
Average proteome isoelectric point is 7.25
Get precalculated fractions of proteins

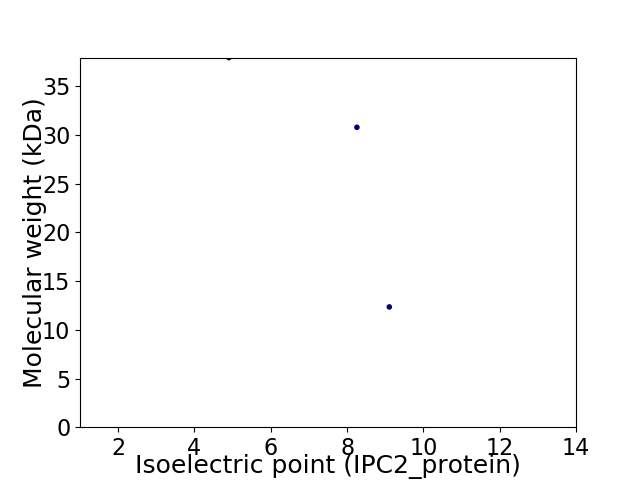
Virtual 2D-PAGE plot for 3 proteins (isoelectric point calculated using IPC2_protein)
Get csv file with sequences according to given criteria:
* You can choose from 21 different methods for calculating isoelectric point
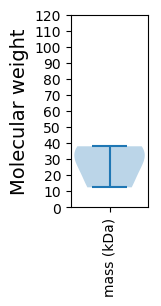
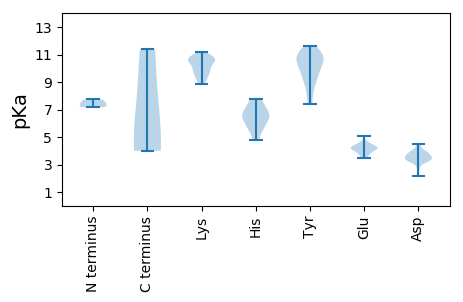
Summary statistics related to proteome-wise predictions


Protein with the lowest isoelectric point:
>tr|A0A345MRS2|A0A345MRS2_9VIRU Rep protein OS=Macaque stool associated virus 11 OX=2499233 PE=4 SV=1
MM1 pKa = 7.17VFVKK5 pKa = 10.66VSEE8 pKa = 4.44TYY10 pKa = 10.76DD11 pKa = 3.42LSTVPNKK18 pKa = 9.86MGVIGVHH25 pKa = 5.69TPDD28 pKa = 4.46ASLISANWPGLLMNCKK44 pKa = 9.29KK45 pKa = 10.21FRR47 pKa = 11.84YY48 pKa = 9.11VEE50 pKa = 4.35CNVTLACASMLPADD64 pKa = 4.41PLQIGTEE71 pKa = 4.1SGDD74 pKa = 3.41IAPQDD79 pKa = 3.6MFNPILYY86 pKa = 9.8RR87 pKa = 11.84AVSNQTMDD95 pKa = 3.89SIEE98 pKa = 4.18HH99 pKa = 6.69RR100 pKa = 11.84LADD103 pKa = 3.31MMYY106 pKa = 10.28AGEE109 pKa = 4.17GSYY112 pKa = 10.74NVNGPSVLEE121 pKa = 4.17SQDD124 pKa = 3.7GILPLTKK131 pKa = 10.4NHH133 pKa = 6.13WDD135 pKa = 3.24VYY137 pKa = 11.03YY138 pKa = 11.11GLLSNRR144 pKa = 11.84HH145 pKa = 4.76GWRR148 pKa = 11.84TAMPQQGLSMNGLAPLVHH166 pKa = 6.42EE167 pKa = 4.54RR168 pKa = 11.84LYY170 pKa = 11.0AYY172 pKa = 9.61GVQNAIGTSNNGAVVDD188 pKa = 4.0VLSNGTNDD196 pKa = 3.62SGQTTIASFTNPPMVGRR213 pKa = 11.84AHH215 pKa = 7.36PMPSFPTVALAVRR228 pKa = 11.84DD229 pKa = 3.89NGVQQMNAWEE239 pKa = 4.27NLPGDD244 pKa = 3.99TAVSSTFSKK253 pKa = 10.44IQIDD257 pKa = 4.13QTSMPYY263 pKa = 9.66IPPVFVACIIMPPAKK278 pKa = 10.26LNRR281 pKa = 11.84LYY283 pKa = 11.39YY284 pKa = 10.36RR285 pKa = 11.84MNVEE289 pKa = 3.62WTVEE293 pKa = 4.05FTEE296 pKa = 4.16IRR298 pKa = 11.84PISEE302 pKa = 3.47IMGFSALEE310 pKa = 3.78EE311 pKa = 4.29LGKK314 pKa = 8.99FTYY317 pKa = 8.64FTDD320 pKa = 3.81YY321 pKa = 11.02VQAKK325 pKa = 9.86SLSTTMNTVDD335 pKa = 3.79VASMDD340 pKa = 3.33IEE342 pKa = 4.19KK343 pKa = 10.85VMM345 pKa = 4.58
MM1 pKa = 7.17VFVKK5 pKa = 10.66VSEE8 pKa = 4.44TYY10 pKa = 10.76DD11 pKa = 3.42LSTVPNKK18 pKa = 9.86MGVIGVHH25 pKa = 5.69TPDD28 pKa = 4.46ASLISANWPGLLMNCKK44 pKa = 9.29KK45 pKa = 10.21FRR47 pKa = 11.84YY48 pKa = 9.11VEE50 pKa = 4.35CNVTLACASMLPADD64 pKa = 4.41PLQIGTEE71 pKa = 4.1SGDD74 pKa = 3.41IAPQDD79 pKa = 3.6MFNPILYY86 pKa = 9.8RR87 pKa = 11.84AVSNQTMDD95 pKa = 3.89SIEE98 pKa = 4.18HH99 pKa = 6.69RR100 pKa = 11.84LADD103 pKa = 3.31MMYY106 pKa = 10.28AGEE109 pKa = 4.17GSYY112 pKa = 10.74NVNGPSVLEE121 pKa = 4.17SQDD124 pKa = 3.7GILPLTKK131 pKa = 10.4NHH133 pKa = 6.13WDD135 pKa = 3.24VYY137 pKa = 11.03YY138 pKa = 11.11GLLSNRR144 pKa = 11.84HH145 pKa = 4.76GWRR148 pKa = 11.84TAMPQQGLSMNGLAPLVHH166 pKa = 6.42EE167 pKa = 4.54RR168 pKa = 11.84LYY170 pKa = 11.0AYY172 pKa = 9.61GVQNAIGTSNNGAVVDD188 pKa = 4.0VLSNGTNDD196 pKa = 3.62SGQTTIASFTNPPMVGRR213 pKa = 11.84AHH215 pKa = 7.36PMPSFPTVALAVRR228 pKa = 11.84DD229 pKa = 3.89NGVQQMNAWEE239 pKa = 4.27NLPGDD244 pKa = 3.99TAVSSTFSKK253 pKa = 10.44IQIDD257 pKa = 4.13QTSMPYY263 pKa = 9.66IPPVFVACIIMPPAKK278 pKa = 10.26LNRR281 pKa = 11.84LYY283 pKa = 11.39YY284 pKa = 10.36RR285 pKa = 11.84MNVEE289 pKa = 3.62WTVEE293 pKa = 4.05FTEE296 pKa = 4.16IRR298 pKa = 11.84PISEE302 pKa = 3.47IMGFSALEE310 pKa = 3.78EE311 pKa = 4.29LGKK314 pKa = 8.99FTYY317 pKa = 8.64FTDD320 pKa = 3.81YY321 pKa = 11.02VQAKK325 pKa = 9.86SLSTTMNTVDD335 pKa = 3.79VASMDD340 pKa = 3.33IEE342 pKa = 4.19KK343 pKa = 10.85VMM345 pKa = 4.58
Molecular weight: 37.95 kDa
Isoelectric point according different methods:
Protein with the highest isoelectric point:
>tr|A0A345MRS1|A0A345MRS1_9VIRU Putative capsid protein OS=Macaque stool associated virus 11 OX=2499233 PE=4 SV=1
MM1 pKa = 7.73SYY3 pKa = 10.78NADD6 pKa = 3.23VLKK9 pKa = 10.58RR10 pKa = 11.84YY11 pKa = 9.5ISSRR15 pKa = 11.84LGAYY19 pKa = 7.6WDD21 pKa = 3.69YY22 pKa = 8.57WTEE25 pKa = 4.33VPTTWGQFKK34 pKa = 10.31AQSVLGGVFPVAQALYY50 pKa = 10.22KK51 pKa = 10.76VRR53 pKa = 11.84DD54 pKa = 3.87TEE56 pKa = 4.33NKK58 pKa = 9.7YY59 pKa = 10.89NDD61 pKa = 3.6YY62 pKa = 11.13YY63 pKa = 11.46KK64 pKa = 10.01NQPYY68 pKa = 10.56AGFPRR73 pKa = 11.84YY74 pKa = 9.07PSLTDD79 pKa = 3.23YY80 pKa = 11.08AQVYY84 pKa = 9.51SYY86 pKa = 11.65ASSSVMNFVSDD97 pKa = 3.94NIGRR101 pKa = 11.84LYY103 pKa = 10.47RR104 pKa = 11.84SKK106 pKa = 11.38
MM1 pKa = 7.73SYY3 pKa = 10.78NADD6 pKa = 3.23VLKK9 pKa = 10.58RR10 pKa = 11.84YY11 pKa = 9.5ISSRR15 pKa = 11.84LGAYY19 pKa = 7.6WDD21 pKa = 3.69YY22 pKa = 8.57WTEE25 pKa = 4.33VPTTWGQFKK34 pKa = 10.31AQSVLGGVFPVAQALYY50 pKa = 10.22KK51 pKa = 10.76VRR53 pKa = 11.84DD54 pKa = 3.87TEE56 pKa = 4.33NKK58 pKa = 9.7YY59 pKa = 10.89NDD61 pKa = 3.6YY62 pKa = 11.13YY63 pKa = 11.46KK64 pKa = 10.01NQPYY68 pKa = 10.56AGFPRR73 pKa = 11.84YY74 pKa = 9.07PSLTDD79 pKa = 3.23YY80 pKa = 11.08AQVYY84 pKa = 9.51SYY86 pKa = 11.65ASSSVMNFVSDD97 pKa = 3.94NIGRR101 pKa = 11.84LYY103 pKa = 10.47RR104 pKa = 11.84SKK106 pKa = 11.38
Molecular weight: 12.35 kDa
Isoelectric point according different methods:
Peptides (in silico digests for buttom-up proteomics)
Below you can find in silico digests of the whole proteome with Trypsin, Chymotrypsin, Trypsin+LysC, LysN, ArgC proteases suitable for different mass spec machines.| Try ESI |
 |
|---|
| ChTry ESI |
 |
|---|
| ArgC ESI |
 |
|---|
| LysN ESI |
 |
|---|
| TryLysC ESI |
 |
|---|
| Try MALDI |
 |
|---|
| ChTry MALDI |
 |
|---|
| ArgC MALDI |
 |
|---|
| LysN MALDI |
 |
|---|
| TryLysC MALDI |
 |
|---|
| Try LTQ |
 |
|---|
| ChTry LTQ |
 |
|---|
| ArgC LTQ |
 |
|---|
| LysN LTQ |
 |
|---|
| TryLysC LTQ |
 |
|---|
| Try MSlow |
 |
|---|
| ChTry MSlow |
 |
|---|
| ArgC MSlow |
 |
|---|
| LysN MSlow |
 |
|---|
| TryLysC MSlow |
 |
|---|
| Try MShigh |
 |
|---|
| ChTry MShigh |
 |
|---|
| ArgC MShigh |
 |
|---|
| LysN MShigh |
 |
|---|
| TryLysC MShigh |
 |
|---|
General Statistics
Number of major isoforms |
Number of additional isoforms |
Number of all proteins |
Number of amino acids |
Min. Seq. Length |
Max. Seq. Length |
Avg. Seq. Length |
Avg. Mol. Weight |
|---|---|---|---|---|---|---|---|
0 |
712 |
106 |
345 |
237.3 |
27.03 |
Amino acid frequency
Ala |
Cys |
Asp |
Glu |
Phe |
Gly |
His |
Ile |
Lys |
Leu |
|---|---|---|---|---|---|---|---|---|---|
6.039 ± 1.052 | 1.264 ± 0.356 |
5.478 ± 0.362 | 4.916 ± 0.996 |
3.511 ± 0.203 | 6.461 ± 0.191 |
1.966 ± 0.58 | 6.32 ± 1.597 |
5.758 ± 1.981 | 6.601 ± 0.584 |
Met |
Asn |
Gln |
Pro |
Arg |
Ser |
Thr |
Val |
Trp |
Tyr |
|---|---|---|---|---|---|---|---|---|---|
4.073 ± 1.075 | 5.337 ± 0.954 |
5.337 ± 0.861 | 3.792 ± 0.227 |
4.635 ± 0.917 | 6.882 ± 1.3 |
6.32 ± 0.452 | 7.303 ± 1.12 |
2.669 ± 0.823 | 5.337 ± 1.796 |
Most of the basic statistics you can see at this page can be downloaded from this CSV file
Proteome-pI is available under Creative Commons Attribution-NoDerivs license, for more details see here
| Reference: Kozlowski LP. Proteome-pI 2.0: Proteome Isoelectric Point Database Update. Nucleic Acids Res. 2021, doi: 10.1093/nar/gkab944 | Contact: Lukasz P. Kozlowski |
