Beluga whale coronavirus SW1
Taxonomy: Viruses; Riboviria; Orthornavirae; Pisuviricota; Pisoniviricetes; Nidovirales; Cornidovirineae; Coronaviridae; Orthocoronavirinae; Gammacoronavirus; Cegacovirus
Average proteome isoelectric point is 6.49
Get precalculated fractions of proteins
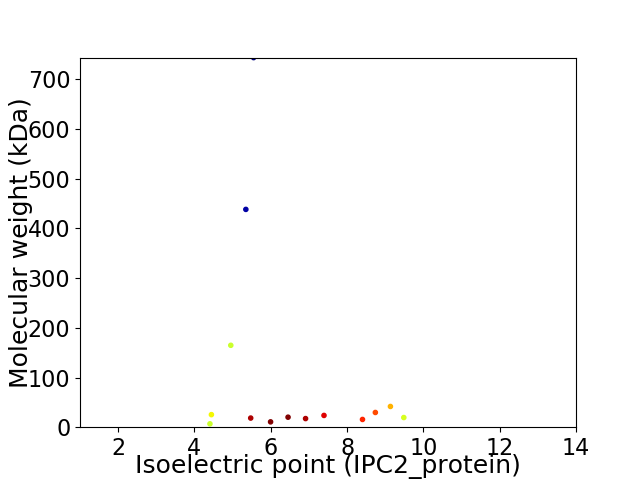
Virtual 2D-PAGE plot for 14 proteins (isoelectric point calculated using IPC2_protein)
Get csv file with sequences according to given criteria:
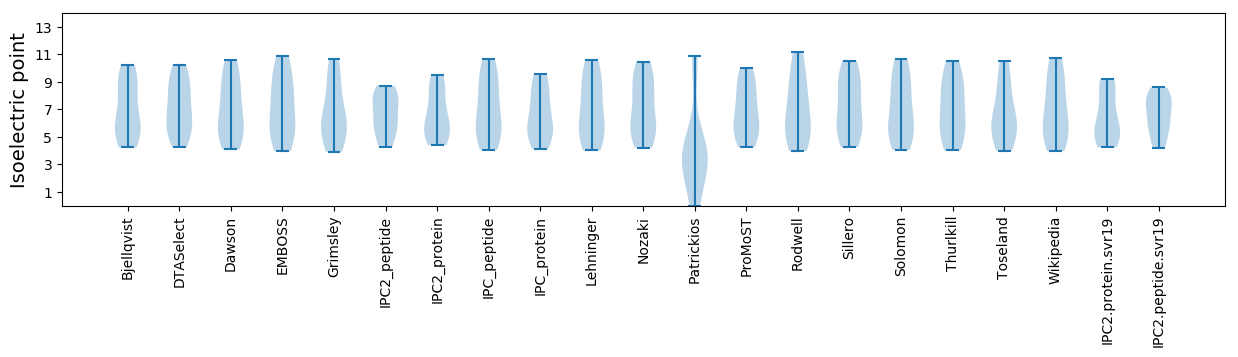
* You can choose from 21 different methods for calculating isoelectric point
Summary statistics related to proteome-wise predictions
Protein with the lowest isoelectric point:
>tr|B2BW42|B2BW42_9GAMC ORF 9 OS=Beluga whale coronavirus SW1 OX=694015 PE=4 SV=1
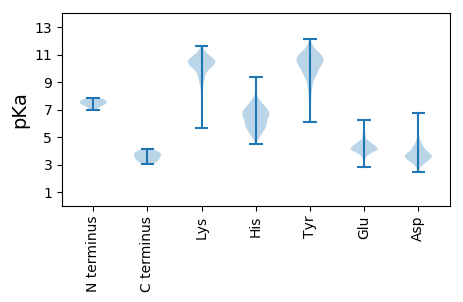
MM1 pKa = 6.99YY2 pKa = 10.45VVLLALFLYY11 pKa = 10.85LLVNEE16 pKa = 4.45EE17 pKa = 4.1TPAIINGLSIIVFILLLEE35 pKa = 4.84EE36 pKa = 4.44CDD38 pKa = 3.83KK39 pKa = 10.72MHH41 pKa = 7.63PLYY44 pKa = 10.31CYY46 pKa = 10.36CRR48 pKa = 11.84MIEE51 pKa = 3.97IPGDD55 pKa = 3.52GFLNN59 pKa = 3.77
MM1 pKa = 6.99YY2 pKa = 10.45VVLLALFLYY11 pKa = 10.85LLVNEE16 pKa = 4.45EE17 pKa = 4.1TPAIINGLSIIVFILLLEE35 pKa = 4.84EE36 pKa = 4.44CDD38 pKa = 3.83KK39 pKa = 10.72MHH41 pKa = 7.63PLYY44 pKa = 10.31CYY46 pKa = 10.36CRR48 pKa = 11.84MIEE51 pKa = 3.97IPGDD55 pKa = 3.52GFLNN59 pKa = 3.77
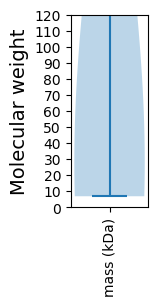
Molecular weight: 6.79 kDa
Isoelectric point according different methods:
Protein with the highest isoelectric point:
>tr|B2BW38|B2BW38_9GAMC ORF 5c OS=Beluga whale coronavirus SW1 OX=694015 PE=4 SV=1
MM1 pKa = 7.67GNFLSNIFTVQVSTNHH17 pKa = 5.89NAHH20 pKa = 5.91VVSAGHH26 pKa = 6.76DD27 pKa = 3.29ASLAASASNMQMHH40 pKa = 6.65FSVTLVITSMLMFVIIIVMFLMLCSIRR67 pKa = 11.84RR68 pKa = 11.84HH69 pKa = 5.47LMPNRR74 pKa = 11.84GRR76 pKa = 11.84SLIGRR81 pKa = 11.84ATRR84 pKa = 11.84AIRR87 pKa = 11.84RR88 pKa = 11.84TFKK91 pKa = 10.57SRR93 pKa = 11.84KK94 pKa = 9.5GGGKK98 pKa = 10.0DD99 pKa = 3.34MEE101 pKa = 4.42EE102 pKa = 3.89LQPLNNQIKK111 pKa = 9.65HH112 pKa = 5.79SSVEE116 pKa = 4.1FKK118 pKa = 11.13KK119 pKa = 10.86NLLTMINEE127 pKa = 3.76VDD129 pKa = 3.62KK130 pKa = 11.44IEE132 pKa = 4.37ASRR135 pKa = 11.84KK136 pKa = 8.58EE137 pKa = 3.84EE138 pKa = 3.9PFYY141 pKa = 11.39EE142 pKa = 4.47EE143 pKa = 4.71IKK145 pKa = 10.69LKK147 pKa = 10.64PSTKK151 pKa = 9.74KK152 pKa = 10.41YY153 pKa = 10.01RR154 pKa = 11.84APQPPKK160 pKa = 10.03ISSTPIYY167 pKa = 9.59INHH170 pKa = 6.13VGG172 pKa = 3.18
MM1 pKa = 7.67GNFLSNIFTVQVSTNHH17 pKa = 5.89NAHH20 pKa = 5.91VVSAGHH26 pKa = 6.76DD27 pKa = 3.29ASLAASASNMQMHH40 pKa = 6.65FSVTLVITSMLMFVIIIVMFLMLCSIRR67 pKa = 11.84RR68 pKa = 11.84HH69 pKa = 5.47LMPNRR74 pKa = 11.84GRR76 pKa = 11.84SLIGRR81 pKa = 11.84ATRR84 pKa = 11.84AIRR87 pKa = 11.84RR88 pKa = 11.84TFKK91 pKa = 10.57SRR93 pKa = 11.84KK94 pKa = 9.5GGGKK98 pKa = 10.0DD99 pKa = 3.34MEE101 pKa = 4.42EE102 pKa = 3.89LQPLNNQIKK111 pKa = 9.65HH112 pKa = 5.79SSVEE116 pKa = 4.1FKK118 pKa = 11.13KK119 pKa = 10.86NLLTMINEE127 pKa = 3.76VDD129 pKa = 3.62KK130 pKa = 11.44IEE132 pKa = 4.37ASRR135 pKa = 11.84KK136 pKa = 8.58EE137 pKa = 3.84EE138 pKa = 3.9PFYY141 pKa = 11.39EE142 pKa = 4.47EE143 pKa = 4.71IKK145 pKa = 10.69LKK147 pKa = 10.64PSTKK151 pKa = 9.74KK152 pKa = 10.41YY153 pKa = 10.01RR154 pKa = 11.84APQPPKK160 pKa = 10.03ISSTPIYY167 pKa = 9.59INHH170 pKa = 6.13VGG172 pKa = 3.18
Molecular weight: 19.44 kDa
Isoelectric point according different methods:
Peptides (in silico digests for buttom-up proteomics)
Below you can find in silico digests of the whole proteome with Trypsin, Chymotrypsin, Trypsin+LysC, LysN, ArgC proteases suitable for different mass spec machines.| Try ESI |
 |
|---|
| ChTry ESI |
|
|---|
| ArgC ESI |
|
|---|
| LysN ESI |
|
|---|
| TryLysC ESI |
|
|---|
| Try MALDI |
|
|---|
| ChTry MALDI |
|
|---|
| ArgC MALDI |
|
|---|
| LysN MALDI |
|
|---|
| TryLysC MALDI |
|
|---|
| Try LTQ |
|
|---|
| ChTry LTQ |
|
|---|
| ArgC LTQ |
|
|---|
| LysN LTQ |
|
|---|
| TryLysC LTQ |
|
|---|
| Try MSlow |
|
|---|
| ChTry MSlow |
|
|---|
| ArgC MSlow |
|
|---|
| LysN MSlow |
|
|---|
| TryLysC MSlow |
|
|---|
| Try MShigh |
|
|---|
| ChTry MShigh |
|
|---|
| ArgC MShigh |
|
|---|
| LysN MShigh |
|
|---|
| TryLysC MShigh |
|
|---|
General Statistics
Number of major isoforms |
Number of additional isoforms |
Number of all proteins |
Number of amino acids |
Min. Seq. Length |
Max. Seq. Length |
Avg. Seq. Length |
Avg. Mol. Weight |
|---|---|---|---|---|---|---|---|
0 |
14128 |
59 |
6663 |
1009.1 |
112.58 |
Amino acid frequency
Ala |
Cys |
Asp |
Glu |
Phe |
Gly |
His |
Ile |
Lys |
Leu |
|---|---|---|---|---|---|---|---|---|---|
7.106 ± 0.333 | 2.803 ± 0.184 |
5.514 ± 0.211 | 5.627 ± 0.307 |
4.891 ± 0.327 | 6.689 ± 0.219 |
1.925 ± 0.211 | 5.21 ± 0.401 |
6.264 ± 0.366 | 8.175 ± 0.194 |
Met |
Asn |
Gln |
Pro |
Arg |
Ser |
Thr |
Val |
Trp |
Tyr |
|---|---|---|---|---|---|---|---|---|---|
2.492 ± 0.117 | 5.153 ± 0.369 |
3.928 ± 0.201 | 3.157 ± 0.237 |
3.539 ± 0.348 | 7.106 ± 0.199 |
5.33 ± 0.24 | 9.11 ± 0.602 |
1.097 ± 0.103 | 4.884 ± 0.177 |
Most of the basic statistics you can see at this page can be downloaded from this CSV file
See this proteome in:

Proteome-pI is available under Creative Commons Attribution-NoDerivs license, for more details see here
| Reference: Kozlowski LP. Proteome-pI 2.0: Proteome Isoelectric Point Database Update. Nucleic Acids Res. 2021, doi: 10.1093/nar/gkab944 | Contact: Lukasz P. Kozlowski |