Landjia virus
Taxonomy: Viruses; Riboviria; Orthornavirae; Negarnaviricota; Haploviricotina; Monjiviricetes; Mononegavirales; Rhabdoviridae; Alpharhabdovirinae; Hapavirus; Landjia hapavirus
Average proteome isoelectric point is 6.91
Get precalculated fractions of proteins

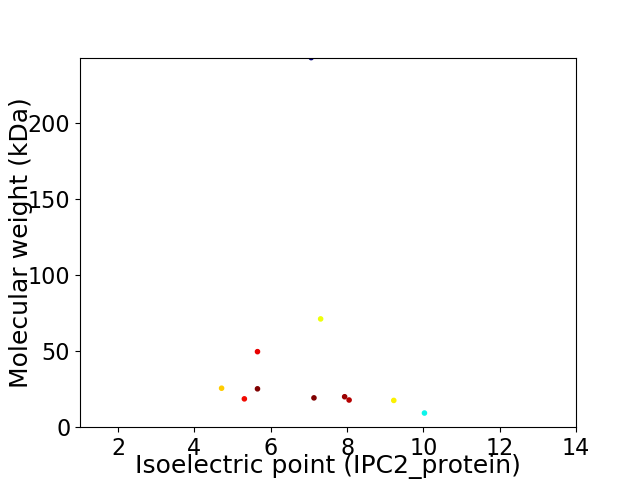
Virtual 2D-PAGE plot for 11 proteins (isoelectric point calculated using IPC2_protein)
Get csv file with sequences according to given criteria:
* You can choose from 21 different methods for calculating isoelectric point
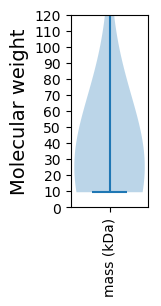
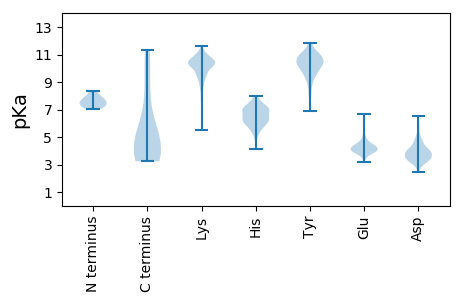
Summary statistics related to proteome-wise predictions


Protein with the lowest isoelectric point:
>tr|A0A0D3R1U5|A0A0D3R1U5_9RHAB Uncharacterized protein OS=Landjia virus OX=1272947 PE=4 SV=1
MM1 pKa = 7.16EE2 pKa = 4.69QEE4 pKa = 3.97QQINCPYY11 pKa = 10.89DD12 pKa = 3.28WDD14 pKa = 4.09AMSNSLKK21 pKa = 10.48QADD24 pKa = 3.9NEE26 pKa = 4.45EE27 pKa = 4.04EE28 pKa = 5.32DD29 pKa = 4.5EE30 pKa = 4.59LCTAPSKK37 pKa = 10.76PSILPTSDD45 pKa = 3.74SDD47 pKa = 3.42WAEE50 pKa = 3.96SVMSPQEE57 pKa = 3.92PCPEE61 pKa = 4.36KK62 pKa = 10.83EE63 pKa = 4.83DD64 pKa = 4.07DD65 pKa = 5.55QSDD68 pKa = 3.65DD69 pKa = 4.36DD70 pKa = 4.48YY71 pKa = 11.85NEE73 pKa = 3.99PVEE76 pKa = 4.48DD77 pKa = 3.88VRR79 pKa = 11.84SSLDD83 pKa = 3.53TLVHH87 pKa = 6.1VPDD90 pKa = 4.1HH91 pKa = 6.05LSIRR95 pKa = 11.84EE96 pKa = 3.93EE97 pKa = 3.76VRR99 pKa = 11.84LIGDD103 pKa = 4.07IQQLVYY109 pKa = 11.18VLTNGQKK116 pKa = 10.83KK117 pKa = 8.75MDD119 pKa = 3.49VMTKK123 pKa = 9.27EE124 pKa = 4.09GKK126 pKa = 10.21KK127 pKa = 9.88ILILNDD133 pKa = 2.81INTPSTKK140 pKa = 10.37SKK142 pKa = 10.51VPIRR146 pKa = 11.84KK147 pKa = 8.41EE148 pKa = 3.58RR149 pKa = 11.84ALDD152 pKa = 3.74DD153 pKa = 4.42AGCIHH158 pKa = 7.78LARR161 pKa = 11.84VVQDD165 pKa = 3.5LGKK168 pKa = 10.38GIKK171 pKa = 9.38VNKK174 pKa = 9.46ILGGVSTLTWRR185 pKa = 11.84SLLIDD190 pKa = 4.65PDD192 pKa = 5.33DD193 pKa = 4.01IDD195 pKa = 3.64RR196 pKa = 11.84SKK198 pKa = 11.25AYY200 pKa = 9.43TSAASAYY207 pKa = 9.34KK208 pKa = 10.3AIIKK212 pKa = 9.42LSPNYY217 pKa = 10.35SIIKK221 pKa = 9.87ARR223 pKa = 11.84YY224 pKa = 6.86KK225 pKa = 10.62CPYY228 pKa = 9.19
MM1 pKa = 7.16EE2 pKa = 4.69QEE4 pKa = 3.97QQINCPYY11 pKa = 10.89DD12 pKa = 3.28WDD14 pKa = 4.09AMSNSLKK21 pKa = 10.48QADD24 pKa = 3.9NEE26 pKa = 4.45EE27 pKa = 4.04EE28 pKa = 5.32DD29 pKa = 4.5EE30 pKa = 4.59LCTAPSKK37 pKa = 10.76PSILPTSDD45 pKa = 3.74SDD47 pKa = 3.42WAEE50 pKa = 3.96SVMSPQEE57 pKa = 3.92PCPEE61 pKa = 4.36KK62 pKa = 10.83EE63 pKa = 4.83DD64 pKa = 4.07DD65 pKa = 5.55QSDD68 pKa = 3.65DD69 pKa = 4.36DD70 pKa = 4.48YY71 pKa = 11.85NEE73 pKa = 3.99PVEE76 pKa = 4.48DD77 pKa = 3.88VRR79 pKa = 11.84SSLDD83 pKa = 3.53TLVHH87 pKa = 6.1VPDD90 pKa = 4.1HH91 pKa = 6.05LSIRR95 pKa = 11.84EE96 pKa = 3.93EE97 pKa = 3.76VRR99 pKa = 11.84LIGDD103 pKa = 4.07IQQLVYY109 pKa = 11.18VLTNGQKK116 pKa = 10.83KK117 pKa = 8.75MDD119 pKa = 3.49VMTKK123 pKa = 9.27EE124 pKa = 4.09GKK126 pKa = 10.21KK127 pKa = 9.88ILILNDD133 pKa = 2.81INTPSTKK140 pKa = 10.37SKK142 pKa = 10.51VPIRR146 pKa = 11.84KK147 pKa = 8.41EE148 pKa = 3.58RR149 pKa = 11.84ALDD152 pKa = 3.74DD153 pKa = 4.42AGCIHH158 pKa = 7.78LARR161 pKa = 11.84VVQDD165 pKa = 3.5LGKK168 pKa = 10.38GIKK171 pKa = 9.38VNKK174 pKa = 9.46ILGGVSTLTWRR185 pKa = 11.84SLLIDD190 pKa = 4.65PDD192 pKa = 5.33DD193 pKa = 4.01IDD195 pKa = 3.64RR196 pKa = 11.84SKK198 pKa = 11.25AYY200 pKa = 9.43TSAASAYY207 pKa = 9.34KK208 pKa = 10.3AIIKK212 pKa = 9.42LSPNYY217 pKa = 10.35SIIKK221 pKa = 9.87ARR223 pKa = 11.84YY224 pKa = 6.86KK225 pKa = 10.62CPYY228 pKa = 9.19
Molecular weight: 25.6 kDa
Isoelectric point according different methods:
Protein with the highest isoelectric point:
>tr|A0A0D3R1F1|A0A0D3R1F1_9RHAB Matrix OS=Landjia virus OX=1272947 PE=4 SV=1
MM1 pKa = 7.35KK2 pKa = 10.54KK3 pKa = 10.44KK4 pKa = 9.62MNSVQHH10 pKa = 5.85HH11 pKa = 5.78RR12 pKa = 11.84NHH14 pKa = 6.55RR15 pKa = 11.84FFRR18 pKa = 11.84HH19 pKa = 5.49LTPIGQSLLCLHH31 pKa = 7.06RR32 pKa = 11.84NHH34 pKa = 6.46AQRR37 pKa = 11.84RR38 pKa = 11.84RR39 pKa = 11.84MISQMMITMNPWRR52 pKa = 11.84MLEE55 pKa = 3.99ALLTLWFMCLIIYY68 pKa = 9.09QLEE71 pKa = 4.31RR72 pKa = 11.84KK73 pKa = 9.65SDD75 pKa = 3.23
MM1 pKa = 7.35KK2 pKa = 10.54KK3 pKa = 10.44KK4 pKa = 9.62MNSVQHH10 pKa = 5.85HH11 pKa = 5.78RR12 pKa = 11.84NHH14 pKa = 6.55RR15 pKa = 11.84FFRR18 pKa = 11.84HH19 pKa = 5.49LTPIGQSLLCLHH31 pKa = 7.06RR32 pKa = 11.84NHH34 pKa = 6.46AQRR37 pKa = 11.84RR38 pKa = 11.84RR39 pKa = 11.84MISQMMITMNPWRR52 pKa = 11.84MLEE55 pKa = 3.99ALLTLWFMCLIIYY68 pKa = 9.09QLEE71 pKa = 4.31RR72 pKa = 11.84KK73 pKa = 9.65SDD75 pKa = 3.23
Molecular weight: 9.3 kDa
Isoelectric point according different methods:
Peptides (in silico digests for buttom-up proteomics)
Below you can find in silico digests of the whole proteome with Trypsin, Chymotrypsin, Trypsin+LysC, LysN, ArgC proteases suitable for different mass spec machines.| Try ESI |
 |
|---|
| ChTry ESI |
 |
|---|
| ArgC ESI |
 |
|---|
| LysN ESI |
 |
|---|
| TryLysC ESI |
 |
|---|
| Try MALDI |
 |
|---|
| ChTry MALDI |
 |
|---|
| ArgC MALDI |
 |
|---|
| LysN MALDI |
 |
|---|
| TryLysC MALDI |
 |
|---|
| Try LTQ |
 |
|---|
| ChTry LTQ |
 |
|---|
| ArgC LTQ |
 |
|---|
| LysN LTQ |
 |
|---|
| TryLysC LTQ |
 |
|---|
| Try MSlow |
 |
|---|
| ChTry MSlow |
 |
|---|
| ArgC MSlow |
 |
|---|
| LysN MSlow |
 |
|---|
| TryLysC MSlow |
 |
|---|
| Try MShigh |
 |
|---|
| ChTry MShigh |
 |
|---|
| ArgC MShigh |
 |
|---|
| LysN MShigh |
 |
|---|
| TryLysC MShigh |
 |
|---|
General Statistics
Number of major isoforms |
Number of additional isoforms |
Number of all proteins |
Number of amino acids |
Min. Seq. Length |
Max. Seq. Length |
Avg. Seq. Length |
Avg. Mol. Weight |
|---|---|---|---|---|---|---|---|
0 |
4482 |
75 |
2109 |
407.5 |
46.98 |
Amino acid frequency
Ala |
Cys |
Asp |
Glu |
Phe |
Gly |
His |
Ile |
Lys |
Leu |
|---|---|---|---|---|---|---|---|---|---|
3.771 ± 0.356 | 1.606 ± 0.178 |
5.756 ± 0.416 | 5.466 ± 0.274 |
4.306 ± 0.456 | 5.221 ± 0.295 |
2.923 ± 0.348 | 8.501 ± 0.412 |
6.961 ± 0.493 | 9.705 ± 0.932 |
Met |
Asn |
Gln |
Pro |
Arg |
Ser |
Thr |
Val |
Trp |
Tyr |
|---|---|---|---|---|---|---|---|---|---|
2.633 ± 0.461 | 6.158 ± 0.38 |
4.395 ± 0.398 | 3.525 ± 0.252 |
4.462 ± 0.35 | 8.099 ± 0.442 |
4.953 ± 0.379 | 5.109 ± 0.26 |
2.164 ± 0.198 | 4.284 ± 0.404 |
Most of the basic statistics you can see at this page can be downloaded from this CSV file
Proteome-pI is available under Creative Commons Attribution-NoDerivs license, for more details see here
| Reference: Kozlowski LP. Proteome-pI 2.0: Proteome Isoelectric Point Database Update. Nucleic Acids Res. 2021, doi: 10.1093/nar/gkab944 | Contact: Lukasz P. Kozlowski |
