Gordonia phage Dogfish
Taxonomy: Viruses; Duplodnaviria; Heunggongvirae; Uroviricota; Caudoviricetes; Caudovirales; Siphoviridae; Nyceiraevirus; unclassified Nyceiraevirus
Average proteome isoelectric point is 6.06
Get precalculated fractions of proteins

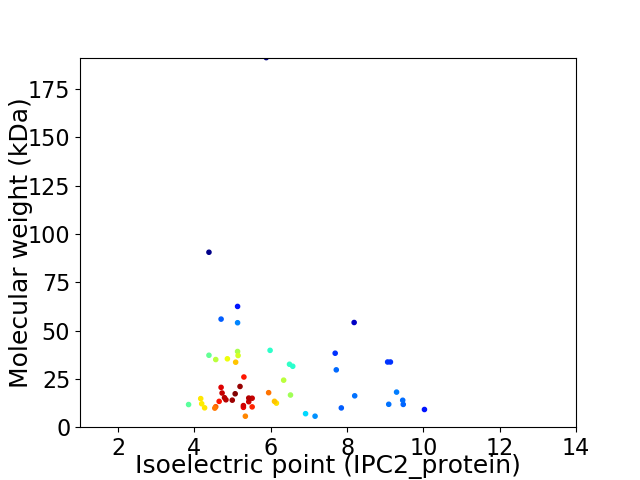
Virtual 2D-PAGE plot for 55 proteins (isoelectric point calculated using IPC2_protein)
Get csv file with sequences according to given criteria:
* You can choose from 21 different methods for calculating isoelectric point
Summary statistics related to proteome-wise predictions


Protein with the lowest isoelectric point:
>tr|A0A481VUV5|A0A481VUV5_9CAUD Minor tail protein OS=Gordonia phage Dogfish OX=2530117 GN=20 PE=4 SV=1
MM1 pKa = 6.71STAIATAAVSAVLTLTACGGGSDD24 pKa = 4.19TPKK27 pKa = 10.39EE28 pKa = 3.92DD29 pKa = 3.53AFTGSGWVSTIITPLVPTSTGVAEE53 pKa = 4.94DD54 pKa = 4.36CDD56 pKa = 3.85HH57 pKa = 6.02VTDD60 pKa = 3.87EE61 pKa = 4.39GRR63 pKa = 11.84IKK65 pKa = 10.88GGVPVTISVGEE76 pKa = 4.14EE77 pKa = 4.09TVGSAILGVGKK88 pKa = 9.99FYY90 pKa = 10.98SDD92 pKa = 4.73SYY94 pKa = 11.31TSGCKK99 pKa = 7.71WQFSAEE105 pKa = 3.9ISRR108 pKa = 11.84TADD111 pKa = 3.07EE112 pKa = 4.44YY113 pKa = 10.88TVQIGDD119 pKa = 3.96SATSTASLDD128 pKa = 3.59EE129 pKa = 4.42LKK131 pKa = 10.92AGSFQFGTQVTAIYY145 pKa = 10.64
MM1 pKa = 6.71STAIATAAVSAVLTLTACGGGSDD24 pKa = 4.19TPKK27 pKa = 10.39EE28 pKa = 3.92DD29 pKa = 3.53AFTGSGWVSTIITPLVPTSTGVAEE53 pKa = 4.94DD54 pKa = 4.36CDD56 pKa = 3.85HH57 pKa = 6.02VTDD60 pKa = 3.87EE61 pKa = 4.39GRR63 pKa = 11.84IKK65 pKa = 10.88GGVPVTISVGEE76 pKa = 4.14EE77 pKa = 4.09TVGSAILGVGKK88 pKa = 9.99FYY90 pKa = 10.98SDD92 pKa = 4.73SYY94 pKa = 11.31TSGCKK99 pKa = 7.71WQFSAEE105 pKa = 3.9ISRR108 pKa = 11.84TADD111 pKa = 3.07EE112 pKa = 4.44YY113 pKa = 10.88TVQIGDD119 pKa = 3.96SATSTASLDD128 pKa = 3.59EE129 pKa = 4.42LKK131 pKa = 10.92AGSFQFGTQVTAIYY145 pKa = 10.64
Molecular weight: 14.8 kDa
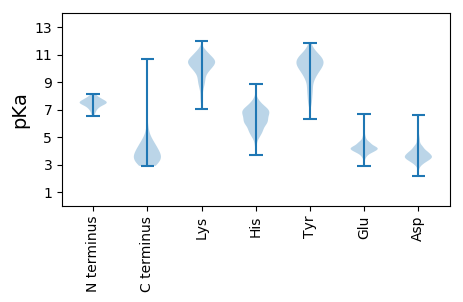
Isoelectric point according different methods:
Protein with the highest isoelectric point:
>tr|A0A481VW16|A0A481VW16_9CAUD Minor tail protein OS=Gordonia phage Dogfish OX=2530117 GN=22 PE=4 SV=1
MM1 pKa = 7.45LRR3 pKa = 11.84FPEE6 pKa = 4.09RR7 pKa = 11.84WQIRR11 pKa = 11.84VPRR14 pKa = 11.84TTRR17 pKa = 11.84TDD19 pKa = 3.35DD20 pKa = 3.31TTGNQVPGPRR30 pKa = 11.84PTPVEE35 pKa = 4.08VNGSLEE41 pKa = 3.88QRR43 pKa = 11.84FPDD46 pKa = 3.32SDD48 pKa = 3.4QRR50 pKa = 11.84EE51 pKa = 4.26VGEE54 pKa = 4.73AIADD58 pKa = 3.63EE59 pKa = 4.31RR60 pKa = 11.84TLVLEE65 pKa = 4.56PAAHH69 pKa = 6.33AKK71 pKa = 9.28VAGGITKK78 pKa = 8.74QHH80 pKa = 5.45QAIGPDD86 pKa = 3.5GTVWSIVRR94 pKa = 11.84VPVPRR99 pKa = 11.84KK100 pKa = 9.22RR101 pKa = 11.84RR102 pKa = 11.84RR103 pKa = 11.84PSAPIRR109 pKa = 11.84YY110 pKa = 8.11LALVVRR116 pKa = 11.84RR117 pKa = 11.84STDD120 pKa = 2.64IKK122 pKa = 11.19EE123 pKa = 3.96NN124 pKa = 3.58
MM1 pKa = 7.45LRR3 pKa = 11.84FPEE6 pKa = 4.09RR7 pKa = 11.84WQIRR11 pKa = 11.84VPRR14 pKa = 11.84TTRR17 pKa = 11.84TDD19 pKa = 3.35DD20 pKa = 3.31TTGNQVPGPRR30 pKa = 11.84PTPVEE35 pKa = 4.08VNGSLEE41 pKa = 3.88QRR43 pKa = 11.84FPDD46 pKa = 3.32SDD48 pKa = 3.4QRR50 pKa = 11.84EE51 pKa = 4.26VGEE54 pKa = 4.73AIADD58 pKa = 3.63EE59 pKa = 4.31RR60 pKa = 11.84TLVLEE65 pKa = 4.56PAAHH69 pKa = 6.33AKK71 pKa = 9.28VAGGITKK78 pKa = 8.74QHH80 pKa = 5.45QAIGPDD86 pKa = 3.5GTVWSIVRR94 pKa = 11.84VPVPRR99 pKa = 11.84KK100 pKa = 9.22RR101 pKa = 11.84RR102 pKa = 11.84RR103 pKa = 11.84PSAPIRR109 pKa = 11.84YY110 pKa = 8.11LALVVRR116 pKa = 11.84RR117 pKa = 11.84STDD120 pKa = 2.64IKK122 pKa = 11.19EE123 pKa = 3.96NN124 pKa = 3.58
Molecular weight: 13.94 kDa
Isoelectric point according different methods:
Peptides (in silico digests for buttom-up proteomics)
Below you can find in silico digests of the whole proteome with Trypsin, Chymotrypsin, Trypsin+LysC, LysN, ArgC proteases suitable for different mass spec machines.| Try ESI |
 |
|---|
| ChTry ESI |
 |
|---|
| ArgC ESI |
 |
|---|
| LysN ESI |
 |
|---|
| TryLysC ESI |
 |
|---|
| Try MALDI |
 |
|---|
| ChTry MALDI |
 |
|---|
| ArgC MALDI |
 |
|---|
| LysN MALDI |
 |
|---|
| TryLysC MALDI |
 |
|---|
| Try LTQ |
 |
|---|
| ChTry LTQ |
 |
|---|
| ArgC LTQ |
 |
|---|
| LysN LTQ |
 |
|---|
| TryLysC LTQ |
 |
|---|
| Try MSlow |
 |
|---|
| ChTry MSlow |
 |
|---|
| ArgC MSlow |
 |
|---|
| LysN MSlow |
 |
|---|
| TryLysC MSlow |
 |
|---|
| Try MShigh |
 |
|---|
| ChTry MShigh |
 |
|---|
| ArgC MShigh |
 |
|---|
| LysN MShigh |
 |
|---|
| TryLysC MShigh |
 |
|---|
General Statistics
Number of major isoforms |
Number of additional isoforms |
Number of all proteins |
Number of amino acids |
Min. Seq. Length |
Max. Seq. Length |
Avg. Seq. Length |
Avg. Mol. Weight |
|---|---|---|---|---|---|---|---|
0 |
13492 |
47 |
1833 |
245.3 |
26.61 |
Amino acid frequency
Ala |
Cys |
Asp |
Glu |
Phe |
Gly |
His |
Ile |
Lys |
Leu |
|---|---|---|---|---|---|---|---|---|---|
11.97 ± 0.659 | 0.734 ± 0.139 |
7.108 ± 0.198 | 5.396 ± 0.306 |
2.446 ± 0.176 | 9.094 ± 0.641 |
1.957 ± 0.242 | 4.291 ± 0.189 |
3.054 ± 0.229 | 8.057 ± 0.352 |
Met |
Asn |
Gln |
Pro |
Arg |
Ser |
Thr |
Val |
Trp |
Tyr |
|---|---|---|---|---|---|---|---|---|---|
2.068 ± 0.179 | 2.742 ± 0.251 |
6.263 ± 0.419 | 3.773 ± 0.348 |
7.619 ± 0.466 | 5.455 ± 0.326 |
6.589 ± 0.246 | 7.056 ± 0.337 |
2.194 ± 0.271 | 2.135 ± 0.184 |
Most of the basic statistics you can see at this page can be downloaded from this CSV file
Proteome-pI is available under Creative Commons Attribution-NoDerivs license, for more details see here
| Reference: Kozlowski LP. Proteome-pI 2.0: Proteome Isoelectric Point Database Update. Nucleic Acids Res. 2021, doi: 10.1093/nar/gkab944 | Contact: Lukasz P. Kozlowski |
