Scopulibacillus darangshiensis
Taxonomy: cellular organisms; Bacteria; Terrabacteria group; Firmicutes; Bacilli; Bacillales; Sporolactobacillaceae; Scopulibacillus
Average proteome isoelectric point is 6.59
Get precalculated fractions of proteins
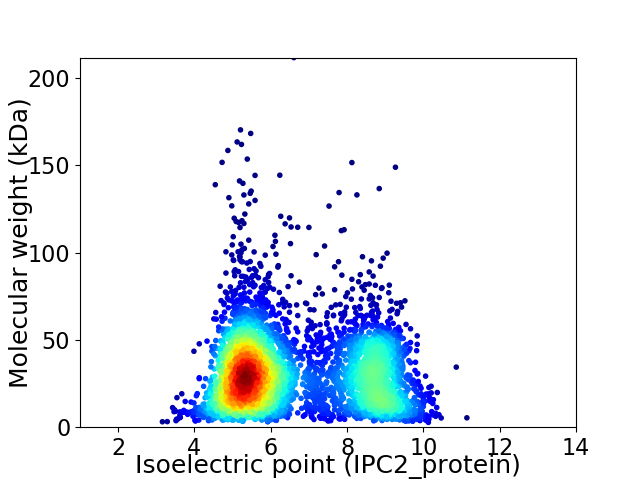
Virtual 2D-PAGE plot for 4593 proteins (isoelectric point calculated using IPC2_protein)
Get csv file with sequences according to given criteria:
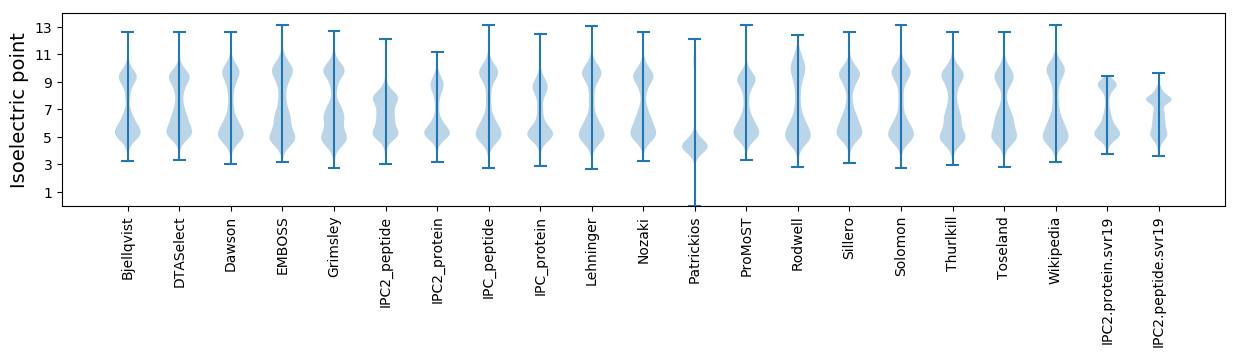
* You can choose from 21 different methods for calculating isoelectric point
Summary statistics related to proteome-wise predictions
Protein with the lowest isoelectric point:
>tr|A0A4V2SMX5|A0A4V2SMX5_9BACL Methylisocitrate lyase OS=Scopulibacillus darangshiensis OX=442528 GN=EV207_11340 PE=3 SV=1
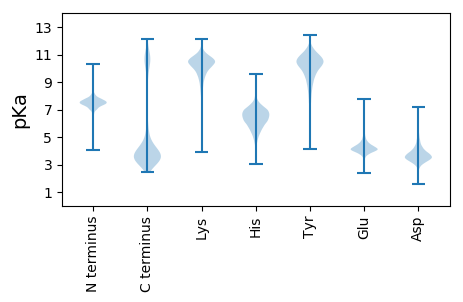
MM1 pKa = 7.39LNVAFGAVNSKK12 pKa = 10.76NMTTTCSIVFGEE24 pKa = 4.11NNQVGWSAHH33 pKa = 4.74GKK35 pKa = 9.54FNYY38 pKa = 10.03ANGWLYY44 pKa = 10.85GVSLNTGVFNNMIDD58 pKa = 3.64NDD60 pKa = 4.24VIDD63 pKa = 4.81TPIQDD68 pKa = 4.12DD69 pKa = 4.11DD70 pKa = 4.73GVPSSQTQGLL80 pKa = 3.76
MM1 pKa = 7.39LNVAFGAVNSKK12 pKa = 10.76NMTTTCSIVFGEE24 pKa = 4.11NNQVGWSAHH33 pKa = 4.74GKK35 pKa = 9.54FNYY38 pKa = 10.03ANGWLYY44 pKa = 10.85GVSLNTGVFNNMIDD58 pKa = 3.64NDD60 pKa = 4.24VIDD63 pKa = 4.81TPIQDD68 pKa = 4.12DD69 pKa = 4.11DD70 pKa = 4.73GVPSSQTQGLL80 pKa = 3.76
Molecular weight: 8.6 kDa
Isoelectric point according different methods:
Protein with the highest isoelectric point:
>tr|A0A4R2NG26|A0A4R2NG26_9BACL Pyridine nucleotide-disulfide oxidoreductase OS=Scopulibacillus darangshiensis OX=442528 GN=EV207_1542 PE=4 SV=1
MM1 pKa = 7.35KK2 pKa = 9.4RR3 pKa = 11.84TYY5 pKa = 10.36QPNTRR10 pKa = 11.84KK11 pKa = 9.75RR12 pKa = 11.84KK13 pKa = 8.32KK14 pKa = 8.57VHH16 pKa = 5.6GFRR19 pKa = 11.84SRR21 pKa = 11.84MQTKK25 pKa = 10.07NGRR28 pKa = 11.84KK29 pKa = 8.31VLARR33 pKa = 11.84RR34 pKa = 11.84RR35 pKa = 11.84RR36 pKa = 11.84KK37 pKa = 9.05GRR39 pKa = 11.84KK40 pKa = 8.7VLSAA44 pKa = 4.05
MM1 pKa = 7.35KK2 pKa = 9.4RR3 pKa = 11.84TYY5 pKa = 10.36QPNTRR10 pKa = 11.84KK11 pKa = 9.75RR12 pKa = 11.84KK13 pKa = 8.32KK14 pKa = 8.57VHH16 pKa = 5.6GFRR19 pKa = 11.84SRR21 pKa = 11.84MQTKK25 pKa = 10.07NGRR28 pKa = 11.84KK29 pKa = 8.31VLARR33 pKa = 11.84RR34 pKa = 11.84RR35 pKa = 11.84RR36 pKa = 11.84KK37 pKa = 9.05GRR39 pKa = 11.84KK40 pKa = 8.7VLSAA44 pKa = 4.05
Molecular weight: 5.37 kDa
Isoelectric point according different methods:
Peptides (in silico digests for buttom-up proteomics)
Below you can find in silico digests of the whole proteome with Trypsin, Chymotrypsin, Trypsin+LysC, LysN, ArgC proteases suitable for different mass spec machines.| Try ESI |
 |
|---|
| ChTry ESI |
|
|---|
| ArgC ESI |
|
|---|
| LysN ESI |
|
|---|
| TryLysC ESI |
|
|---|
| Try MALDI |
|
|---|
| ChTry MALDI |
|
|---|
| ArgC MALDI |
|
|---|
| LysN MALDI |
|
|---|
| TryLysC MALDI |
|
|---|
| Try LTQ |
|
|---|
| ChTry LTQ |
|
|---|
| ArgC LTQ |
|
|---|
| LysN LTQ |
|
|---|
| TryLysC LTQ |
|
|---|
| Try MSlow |
|
|---|
| ChTry MSlow |
|
|---|
| ArgC MSlow |
|
|---|
| LysN MSlow |
|
|---|
| TryLysC MSlow |
|
|---|
| Try MShigh |
|
|---|
| ChTry MShigh |
|
|---|
| ArgC MShigh |
|
|---|
| LysN MShigh |
|
|---|
| TryLysC MShigh |
|
|---|
General Statistics
Number of major isoforms |
Number of additional isoforms |
Number of all proteins |
Number of amino acids |
Min. Seq. Length |
Max. Seq. Length |
Avg. Seq. Length |
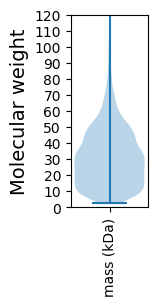
Avg. Mol. Weight |
|---|---|---|---|---|---|---|---|
0 |
1339328 |
25 |
1910 |
291.6 |
32.63 |
Amino acid frequency
Ala |
Cys |
Asp |
Glu |
Phe |
Gly |
His |
Ile |
Lys |
Leu |
|---|---|---|---|---|---|---|---|---|---|
7.327 ± 0.035 | 0.81 ± 0.011 |
5.511 ± 0.035 | 6.581 ± 0.045 |
4.458 ± 0.035 | 7.289 ± 0.035 |
2.27 ± 0.018 | 7.735 ± 0.038 |
7.122 ± 0.041 | 9.613 ± 0.042 |
Met |
Asn |
Gln |
Pro |
Arg |
Ser |
Thr |
Val |
Trp |
Tyr |
|---|---|---|---|---|---|---|---|---|---|
2.807 ± 0.017 | 4.344 ± 0.026 |
3.804 ± 0.019 | 3.522 ± 0.024 |
4.176 ± 0.024 | 5.925 ± 0.025 |
5.292 ± 0.021 | 6.881 ± 0.028 |
1.096 ± 0.015 | 3.439 ± 0.02 |
Most of the basic statistics you can see at this page can be downloaded from this CSV file
See this proteome in:

Proteome-pI is available under Creative Commons Attribution-NoDerivs license, for more details see here
| Reference: Kozlowski LP. Proteome-pI 2.0: Proteome Isoelectric Point Database Update. Nucleic Acids Res. 2021, doi: 10.1093/nar/gkab944 | Contact: Lukasz P. Kozlowski |