Propionimicrobium lymphophilum ACS-093-V-SCH5
Taxonomy: cellular organisms; Bacteria; Terrabacteria group; Actinobacteria; Actinomycetia; Propionibacteriales; Propionibacteriaceae; Propionimicrobium; Propionimicrobium lymphophilum
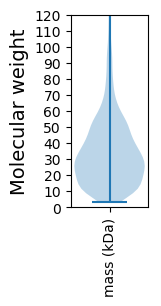
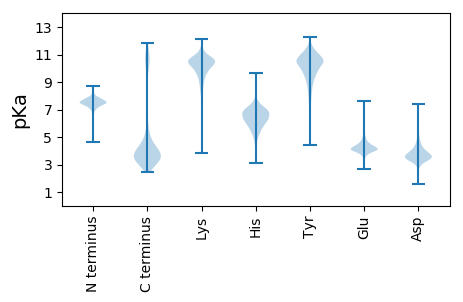
Average proteome isoelectric point is 6.09
Get precalculated fractions of proteins

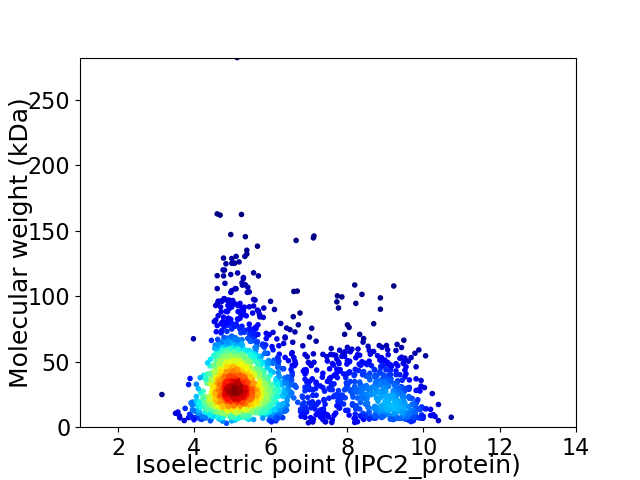
Virtual 2D-PAGE plot for 2076 proteins (isoelectric point calculated using IPC2_protein)
Get csv file with sequences according to given criteria:
* You can choose from 21 different methods for calculating isoelectric point
Summary statistics related to proteome-wise predictions


Protein with the lowest isoelectric point:
>tr|S2VYT4|S2VYT4_9ACTN Uncharacterized protein OS=Propionimicrobium lymphophilum ACS-093-V-SCH5 OX=883161 GN=HMPREF9306_01377 PE=4 SV=1
MM1 pKa = 6.39ITNYY5 pKa = 10.07KK6 pKa = 7.62ITGMTCGHH14 pKa = 6.76CVNAVTSEE22 pKa = 3.81VSEE25 pKa = 4.1IDD27 pKa = 3.26GVTDD31 pKa = 3.4VDD33 pKa = 3.93VQLEE37 pKa = 4.27GGKK40 pKa = 8.58MAVTSEE46 pKa = 4.2SEE48 pKa = 3.72IDD50 pKa = 3.56FEE52 pKa = 5.09AIKK55 pKa = 10.42EE56 pKa = 4.27AVDD59 pKa = 3.27EE60 pKa = 4.83AGDD63 pKa = 3.89YY64 pKa = 9.83TVEE67 pKa = 4.07LAA69 pKa = 4.92
MM1 pKa = 6.39ITNYY5 pKa = 10.07KK6 pKa = 7.62ITGMTCGHH14 pKa = 6.76CVNAVTSEE22 pKa = 3.81VSEE25 pKa = 4.1IDD27 pKa = 3.26GVTDD31 pKa = 3.4VDD33 pKa = 3.93VQLEE37 pKa = 4.27GGKK40 pKa = 8.58MAVTSEE46 pKa = 4.2SEE48 pKa = 3.72IDD50 pKa = 3.56FEE52 pKa = 5.09AIKK55 pKa = 10.42EE56 pKa = 4.27AVDD59 pKa = 3.27EE60 pKa = 4.83AGDD63 pKa = 3.89YY64 pKa = 9.83TVEE67 pKa = 4.07LAA69 pKa = 4.92
Molecular weight: 7.33 kDa
Isoelectric point according different methods:
Protein with the highest isoelectric point:
>tr|S2W4D3|S2W4D3_9ACTN DNA gyrase subunit B OS=Propionimicrobium lymphophilum ACS-093-V-SCH5 OX=883161 GN=gyrB PE=3 SV=1
MM1 pKa = 7.05NALVAGLGAFLFLFGAFVVVVGARR25 pKa = 11.84SSSSRR30 pKa = 11.84IVSKK34 pKa = 10.33PLNLPKK40 pKa = 10.26ISVRR44 pKa = 11.84TGGVLALSALFALVSGWLPALIVGPGVGLVLPDD77 pKa = 4.06LLRR80 pKa = 11.84PKK82 pKa = 10.23PNRR85 pKa = 11.84EE86 pKa = 4.02VQLLAALDD94 pKa = 3.37RR95 pKa = 11.84WVRR98 pKa = 11.84LLTASVATGKK108 pKa = 10.46SIPDD112 pKa = 3.45AMRR115 pKa = 11.84TTYY118 pKa = 10.32AQCPKK123 pKa = 8.93MLKK126 pKa = 10.16SGVSTALARR135 pKa = 11.84LRR137 pKa = 11.84GRR139 pKa = 11.84WSVRR143 pKa = 11.84EE144 pKa = 3.97SLLALADD151 pKa = 3.68EE152 pKa = 4.79WDD154 pKa = 3.86STDD157 pKa = 3.59ADD159 pKa = 3.79AVLAACILCSEE170 pKa = 4.3RR171 pKa = 11.84GGLGAHH177 pKa = 6.14RR178 pKa = 11.84TLDD181 pKa = 3.56ALADD185 pKa = 3.99SVSDD189 pKa = 3.29RR190 pKa = 11.84LAALRR195 pKa = 11.84EE196 pKa = 3.87IDD198 pKa = 4.07AEE200 pKa = 4.12RR201 pKa = 11.84AKK203 pKa = 10.66PRR205 pKa = 11.84VVVRR209 pKa = 11.84QVTMITVVVLGAGVVINPSYY229 pKa = 10.27FAPFTTPIGQVLAIGFFVCYY249 pKa = 9.29MLSLRR254 pKa = 11.84MLQRR258 pKa = 11.84MSRR261 pKa = 11.84PQKK264 pKa = 10.14RR265 pKa = 11.84EE266 pKa = 3.48RR267 pKa = 11.84ILQVNQQ273 pKa = 3.01
MM1 pKa = 7.05NALVAGLGAFLFLFGAFVVVVGARR25 pKa = 11.84SSSSRR30 pKa = 11.84IVSKK34 pKa = 10.33PLNLPKK40 pKa = 10.26ISVRR44 pKa = 11.84TGGVLALSALFALVSGWLPALIVGPGVGLVLPDD77 pKa = 4.06LLRR80 pKa = 11.84PKK82 pKa = 10.23PNRR85 pKa = 11.84EE86 pKa = 4.02VQLLAALDD94 pKa = 3.37RR95 pKa = 11.84WVRR98 pKa = 11.84LLTASVATGKK108 pKa = 10.46SIPDD112 pKa = 3.45AMRR115 pKa = 11.84TTYY118 pKa = 10.32AQCPKK123 pKa = 8.93MLKK126 pKa = 10.16SGVSTALARR135 pKa = 11.84LRR137 pKa = 11.84GRR139 pKa = 11.84WSVRR143 pKa = 11.84EE144 pKa = 3.97SLLALADD151 pKa = 3.68EE152 pKa = 4.79WDD154 pKa = 3.86STDD157 pKa = 3.59ADD159 pKa = 3.79AVLAACILCSEE170 pKa = 4.3RR171 pKa = 11.84GGLGAHH177 pKa = 6.14RR178 pKa = 11.84TLDD181 pKa = 3.56ALADD185 pKa = 3.99SVSDD189 pKa = 3.29RR190 pKa = 11.84LAALRR195 pKa = 11.84EE196 pKa = 3.87IDD198 pKa = 4.07AEE200 pKa = 4.12RR201 pKa = 11.84AKK203 pKa = 10.66PRR205 pKa = 11.84VVVRR209 pKa = 11.84QVTMITVVVLGAGVVINPSYY229 pKa = 10.27FAPFTTPIGQVLAIGFFVCYY249 pKa = 9.29MLSLRR254 pKa = 11.84MLQRR258 pKa = 11.84MSRR261 pKa = 11.84PQKK264 pKa = 10.14RR265 pKa = 11.84EE266 pKa = 3.48RR267 pKa = 11.84ILQVNQQ273 pKa = 3.01
Molecular weight: 29.32 kDa
Isoelectric point according different methods:
Peptides (in silico digests for buttom-up proteomics)
Below you can find in silico digests of the whole proteome with Trypsin, Chymotrypsin, Trypsin+LysC, LysN, ArgC proteases suitable for different mass spec machines.| Try ESI |
 |
|---|
| ChTry ESI |
 |
|---|
| ArgC ESI |
 |
|---|
| LysN ESI |
 |
|---|
| TryLysC ESI |
 |
|---|
| Try MALDI |
 |
|---|
| ChTry MALDI |
 |
|---|
| ArgC MALDI |
 |
|---|
| LysN MALDI |
 |
|---|
| TryLysC MALDI |
 |
|---|
| Try LTQ |
 |
|---|
| ChTry LTQ |
 |
|---|
| ArgC LTQ |
 |
|---|
| LysN LTQ |
 |
|---|
| TryLysC LTQ |
 |
|---|
| Try MSlow |
 |
|---|
| ChTry MSlow |
 |
|---|
| ArgC MSlow |
 |
|---|
| LysN MSlow |
 |
|---|
| TryLysC MSlow |
 |
|---|
| Try MShigh |
 |
|---|
| ChTry MShigh |
 |
|---|
| ArgC MShigh |
 |
|---|
| LysN MShigh |
 |
|---|
| TryLysC MShigh |
 |
|---|
General Statistics
Number of major isoforms |
Number of additional isoforms |
Number of all proteins |
Number of amino acids |
Min. Seq. Length |
Max. Seq. Length |
Avg. Seq. Length |
Avg. Mol. Weight |
|---|---|---|---|---|---|---|---|
0 |
682374 |
31 |
2653 |
328.7 |
35.85 |
Amino acid frequency
Ala |
Cys |
Asp |
Glu |
Phe |
Gly |
His |
Ile |
Lys |
Leu |
|---|---|---|---|---|---|---|---|---|---|
10.571 ± 0.067 | 0.942 ± 0.015 |
6.086 ± 0.041 | 6.39 ± 0.045 |
3.397 ± 0.037 | 8.034 ± 0.049 |
1.773 ± 0.022 | 5.437 ± 0.042 |
4.699 ± 0.044 | 9.552 ± 0.061 |
Met |
Asn |
Gln |
Pro |
Arg |
Ser |
Thr |
Val |
Trp |
Tyr |
|---|---|---|---|---|---|---|---|---|---|
2.315 ± 0.026 | 3.382 ± 0.029 |
4.735 ± 0.03 | 3.466 ± 0.03 |
5.726 ± 0.053 | 6.368 ± 0.042 |
5.455 ± 0.042 | 7.886 ± 0.05 |
1.417 ± 0.019 | 2.369 ± 0.028 |
Most of the basic statistics you can see at this page can be downloaded from this CSV file
Proteome-pI is available under Creative Commons Attribution-NoDerivs license, for more details see here
| Reference: Kozlowski LP. Proteome-pI 2.0: Proteome Isoelectric Point Database Update. Nucleic Acids Res. 2021, doi: 10.1093/nar/gkab944 | Contact: Lukasz P. Kozlowski |
