Saccharopolyspora rectivirgula
Taxonomy: cellular organisms; Bacteria; Terrabacteria group; Actinobacteria; Actinomycetia; Pseudonocardiales; Pseudonocardiaceae; Saccharopolyspora
Average proteome isoelectric point is 6.14
Get precalculated fractions of proteins
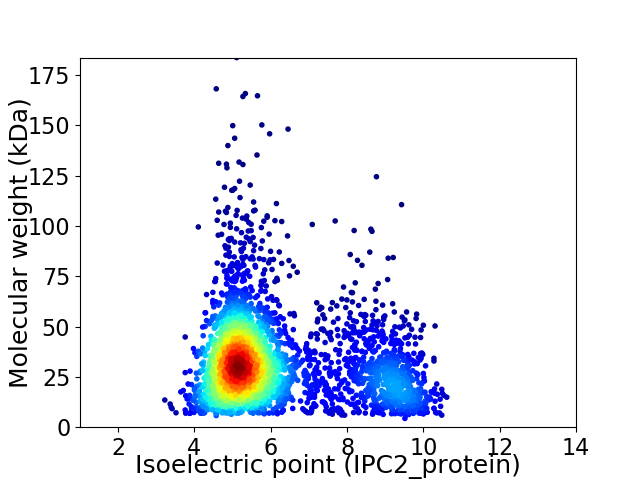
Virtual 2D-PAGE plot for 3222 proteins (isoelectric point calculated using IPC2_protein)
Get csv file with sequences according to given criteria:
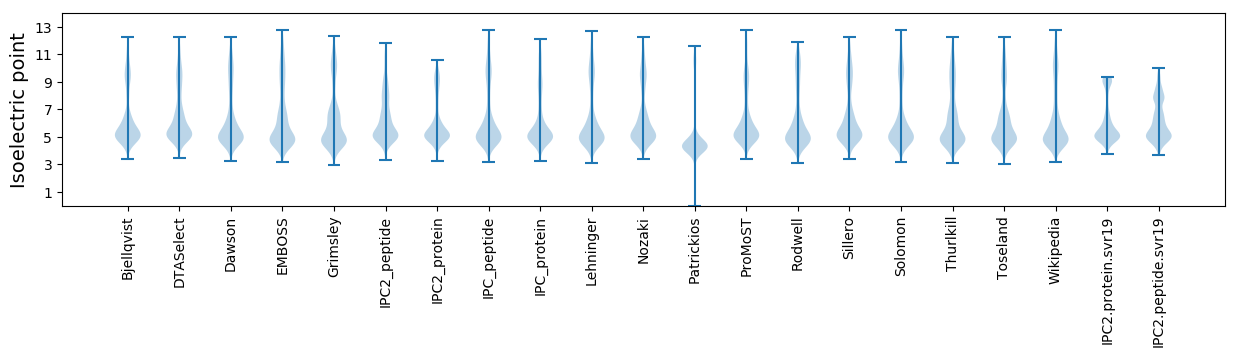
* You can choose from 21 different methods for calculating isoelectric point
Summary statistics related to proteome-wise predictions
Protein with the lowest isoelectric point:
>tr|A0A073B2Q2|A0A073B2Q2_9PSEU Uncharacterized protein OS=Saccharopolyspora rectivirgula OX=28042 GN=GU90_01485 PE=4 SV=1
MM1 pKa = 7.75EE2 pKa = 5.45NPLDD6 pKa = 4.03LKK8 pKa = 10.98AVSDD12 pKa = 4.26PCQLLTPEE20 pKa = 4.56QLAQLEE26 pKa = 4.61NPTEE30 pKa = 4.26AEE32 pKa = 3.97PTEE35 pKa = 4.42LEE37 pKa = 4.12WGEE40 pKa = 4.97KK41 pKa = 8.43GCSWYY46 pKa = 10.79GEE48 pKa = 4.16QYY50 pKa = 11.2GLEE53 pKa = 4.17LSPNTISGGFATIRR67 pKa = 11.84QNQKK71 pKa = 10.55SFDD74 pKa = 3.61NYY76 pKa = 10.83QEE78 pKa = 4.29VEE80 pKa = 4.19VAGYY84 pKa = 8.97QAARR88 pKa = 11.84TDD90 pKa = 3.54ATDD93 pKa = 3.74ISCSLWVAVSDD104 pKa = 4.63DD105 pKa = 3.74STLGVQVGKK114 pKa = 10.93YY115 pKa = 9.41DD116 pKa = 4.26AYY118 pKa = 11.15DD119 pKa = 4.69DD120 pKa = 5.27LPQPCEE126 pKa = 3.64LAEE129 pKa = 4.46KK130 pKa = 10.3IFPEE134 pKa = 4.4VVKK137 pKa = 10.81NIPPQDD143 pKa = 3.24
MM1 pKa = 7.75EE2 pKa = 5.45NPLDD6 pKa = 4.03LKK8 pKa = 10.98AVSDD12 pKa = 4.26PCQLLTPEE20 pKa = 4.56QLAQLEE26 pKa = 4.61NPTEE30 pKa = 4.26AEE32 pKa = 3.97PTEE35 pKa = 4.42LEE37 pKa = 4.12WGEE40 pKa = 4.97KK41 pKa = 8.43GCSWYY46 pKa = 10.79GEE48 pKa = 4.16QYY50 pKa = 11.2GLEE53 pKa = 4.17LSPNTISGGFATIRR67 pKa = 11.84QNQKK71 pKa = 10.55SFDD74 pKa = 3.61NYY76 pKa = 10.83QEE78 pKa = 4.29VEE80 pKa = 4.19VAGYY84 pKa = 8.97QAARR88 pKa = 11.84TDD90 pKa = 3.54ATDD93 pKa = 3.74ISCSLWVAVSDD104 pKa = 4.63DD105 pKa = 3.74STLGVQVGKK114 pKa = 10.93YY115 pKa = 9.41DD116 pKa = 4.26AYY118 pKa = 11.15DD119 pKa = 4.69DD120 pKa = 5.27LPQPCEE126 pKa = 3.64LAEE129 pKa = 4.46KK130 pKa = 10.3IFPEE134 pKa = 4.4VVKK137 pKa = 10.81NIPPQDD143 pKa = 3.24
Molecular weight: 15.8 kDa
Isoelectric point according different methods:
Protein with the highest isoelectric point:
>tr|A0A073BBN0|A0A073BBN0_9PSEU RsdA_SigD_bd domain-containing protein OS=Saccharopolyspora rectivirgula OX=28042 GN=GU90_04915 PE=4 SV=1
MM1 pKa = 7.8KK2 pKa = 10.33ARR4 pKa = 11.84LSRR7 pKa = 11.84PSPRR11 pKa = 11.84MVRR14 pKa = 11.84ALALAVLVTQVLISVTGTIVRR35 pKa = 11.84VTGSGLGCPTWPQCFPGSMVPVSHH59 pKa = 7.58AEE61 pKa = 3.65IAPLHH66 pKa = 5.1QAIEE70 pKa = 4.23FGNRR74 pKa = 11.84LLTFVVGIAAIACFLAAWRR93 pKa = 11.84SRR95 pKa = 11.84PRR97 pKa = 11.84RR98 pKa = 11.84PRR100 pKa = 11.84LVRR103 pKa = 11.84LALVMPLGVVAQAIIGGITVLVDD126 pKa = 3.73LQWWSVSLHH135 pKa = 5.66FLASAVLVWLAAILVKK151 pKa = 9.63TASEE155 pKa = 4.27GDD157 pKa = 4.07DD158 pKa = 3.61KK159 pKa = 11.67PMLVITRR166 pKa = 11.84TMQRR170 pKa = 11.84LLVALSAVTFVMLFAGTLVTAAGPHH195 pKa = 6.43AGDD198 pKa = 3.62AATPRR203 pKa = 11.84LDD205 pKa = 3.67VPVEE209 pKa = 4.13TIARR213 pKa = 11.84VHH215 pKa = 6.66SMSTMAYY222 pKa = 8.87VLLLAVFGVWLRR234 pKa = 11.84SARR237 pKa = 11.84PTKK240 pKa = 10.65ALLKK244 pKa = 10.23AYY246 pKa = 9.99SAACAVVLLQGAIGYY261 pKa = 6.2TQYY264 pKa = 11.95ALGVPEE270 pKa = 4.66PLVVAHH276 pKa = 6.19VLGAMLVVVATSWLWCEE293 pKa = 3.65SRR295 pKa = 11.84YY296 pKa = 10.13RR297 pKa = 11.84GPLPQQKK304 pKa = 9.03QAEE307 pKa = 4.34PAASS311 pKa = 3.2
MM1 pKa = 7.8KK2 pKa = 10.33ARR4 pKa = 11.84LSRR7 pKa = 11.84PSPRR11 pKa = 11.84MVRR14 pKa = 11.84ALALAVLVTQVLISVTGTIVRR35 pKa = 11.84VTGSGLGCPTWPQCFPGSMVPVSHH59 pKa = 7.58AEE61 pKa = 3.65IAPLHH66 pKa = 5.1QAIEE70 pKa = 4.23FGNRR74 pKa = 11.84LLTFVVGIAAIACFLAAWRR93 pKa = 11.84SRR95 pKa = 11.84PRR97 pKa = 11.84RR98 pKa = 11.84PRR100 pKa = 11.84LVRR103 pKa = 11.84LALVMPLGVVAQAIIGGITVLVDD126 pKa = 3.73LQWWSVSLHH135 pKa = 5.66FLASAVLVWLAAILVKK151 pKa = 9.63TASEE155 pKa = 4.27GDD157 pKa = 4.07DD158 pKa = 3.61KK159 pKa = 11.67PMLVITRR166 pKa = 11.84TMQRR170 pKa = 11.84LLVALSAVTFVMLFAGTLVTAAGPHH195 pKa = 6.43AGDD198 pKa = 3.62AATPRR203 pKa = 11.84LDD205 pKa = 3.67VPVEE209 pKa = 4.13TIARR213 pKa = 11.84VHH215 pKa = 6.66SMSTMAYY222 pKa = 8.87VLLLAVFGVWLRR234 pKa = 11.84SARR237 pKa = 11.84PTKK240 pKa = 10.65ALLKK244 pKa = 10.23AYY246 pKa = 9.99SAACAVVLLQGAIGYY261 pKa = 6.2TQYY264 pKa = 11.95ALGVPEE270 pKa = 4.66PLVVAHH276 pKa = 6.19VLGAMLVVVATSWLWCEE293 pKa = 3.65SRR295 pKa = 11.84YY296 pKa = 10.13RR297 pKa = 11.84GPLPQQKK304 pKa = 9.03QAEE307 pKa = 4.34PAASS311 pKa = 3.2
Molecular weight: 33.19 kDa
Isoelectric point according different methods:
Peptides (in silico digests for buttom-up proteomics)
Below you can find in silico digests of the whole proteome with Trypsin, Chymotrypsin, Trypsin+LysC, LysN, ArgC proteases suitable for different mass spec machines.| Try ESI |
 |
|---|
| ChTry ESI |
|
|---|
| ArgC ESI |
|
|---|
| LysN ESI |
|
|---|
| TryLysC ESI |
|
|---|
| Try MALDI |
|
|---|
| ChTry MALDI |
|
|---|
| ArgC MALDI |
|
|---|
| LysN MALDI |
|
|---|
| TryLysC MALDI |
|
|---|
| Try LTQ |
|
|---|
| ChTry LTQ |
|
|---|
| ArgC LTQ |
|
|---|
| LysN LTQ |
|
|---|
| TryLysC LTQ |
|
|---|
| Try MSlow |
|
|---|
| ChTry MSlow |
|
|---|
| ArgC MSlow |
|
|---|
| LysN MSlow |
|
|---|
| TryLysC MSlow |
|
|---|
| Try MShigh |
|
|---|
| ChTry MShigh |
|
|---|
| ArgC MShigh |
|
|---|
| LysN MShigh |
|
|---|
| TryLysC MShigh |
|
|---|
General Statistics
Number of major isoforms |
Number of additional isoforms |
Number of all proteins |
Number of amino acids |
Min. Seq. Length |
Max. Seq. Length |
Avg. Seq. Length |
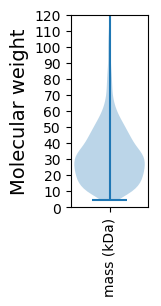
Avg. Mol. Weight |
|---|---|---|---|---|---|---|---|
0 |
1004369 |
37 |
1646 |
311.7 |
33.72 |
Amino acid frequency
Ala |
Cys |
Asp |
Glu |
Phe |
Gly |
His |
Ile |
Lys |
Leu |
|---|---|---|---|---|---|---|---|---|---|
12.221 ± 0.062 | 0.847 ± 0.013 |
5.632 ± 0.034 | 6.696 ± 0.037 |
2.865 ± 0.025 | 8.788 ± 0.042 |
2.222 ± 0.02 | 3.587 ± 0.029 |
2.32 ± 0.025 | 10.433 ± 0.045 |
Met |
Asn |
Gln |
Pro |
Arg |
Ser |
Thr |
Val |
Trp |
Tyr |
|---|---|---|---|---|---|---|---|---|---|
1.776 ± 0.017 | 2.103 ± 0.019 |
5.861 ± 0.039 | 3.609 ± 0.028 |
7.835 ± 0.045 | 5.304 ± 0.028 |
5.478 ± 0.029 | 8.957 ± 0.043 |
1.462 ± 0.018 | 2.003 ± 0.018 |
Most of the basic statistics you can see at this page can be downloaded from this CSV file
See this proteome in:

Proteome-pI is available under Creative Commons Attribution-NoDerivs license, for more details see here
| Reference: Kozlowski LP. Proteome-pI 2.0: Proteome Isoelectric Point Database Update. Nucleic Acids Res. 2021, doi: 10.1093/nar/gkab944 | Contact: Lukasz P. Kozlowski |