Chitinophaga jiangningensis
Taxonomy: cellular organisms; Bacteria; FCB group; Bacteroidetes/Chlorobi group; Bacteroidetes; Chitinophagia; Chitinophagales; Chitinophagaceae; Chitinophaga
Average proteome isoelectric point is 6.84
Get precalculated fractions of proteins

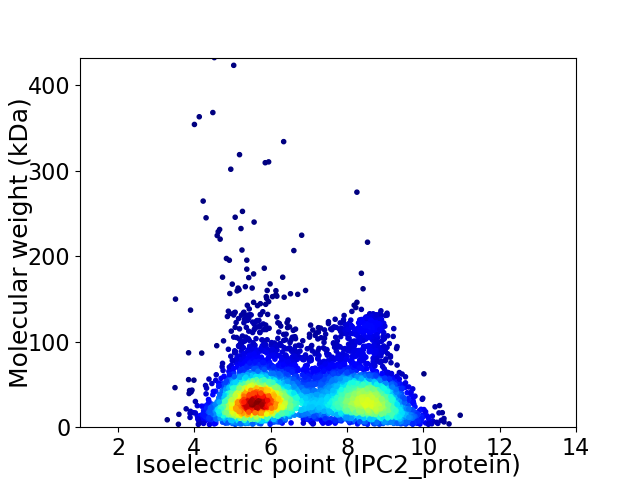
Virtual 2D-PAGE plot for 5782 proteins (isoelectric point calculated using IPC2_protein)
Get csv file with sequences according to given criteria:
* You can choose from 21 different methods for calculating isoelectric point
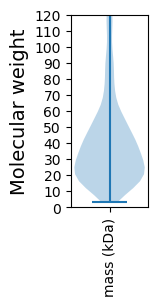
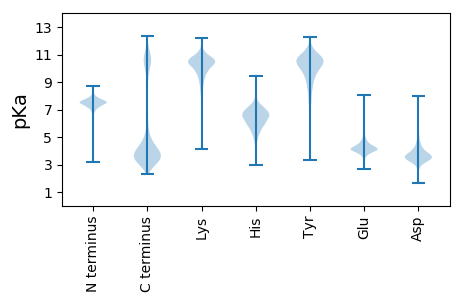
Summary statistics related to proteome-wise predictions


Protein with the lowest isoelectric point:
>tr|A0A1M7IQ35|A0A1M7IQ35_9BACT KDO2-lipid IV(A) lauroyltransferase OS=Chitinophaga jiangningensis OX=1419482 GN=SAMN05444266_10854 PE=4 SV=1
MM1 pKa = 7.44KK2 pKa = 10.59NSARR6 pKa = 11.84LVALQPTPQQLTDD19 pKa = 3.54YY20 pKa = 9.98ANALIVVNSYY30 pKa = 9.36TYY32 pKa = 10.94AVEE35 pKa = 4.08NQQLPTLNAPPTNYY49 pKa = 10.58ADD51 pKa = 5.19FISAFNPVKK60 pKa = 10.59SSAINWSEE68 pKa = 4.14TIFPSITTLPAHH80 pKa = 7.5IINYY84 pKa = 9.69AGSLFNLEE92 pKa = 4.07EE93 pKa = 4.18TLVTGYY99 pKa = 11.33LNILINDD106 pKa = 4.51PGNVAARR113 pKa = 11.84NGLVATLTNMQQTIQAEE130 pKa = 4.58LNFVTDD136 pKa = 3.3IQSNLTAFTTDD147 pKa = 2.98TQTAGQTLQQLAQQALSMAGADD169 pKa = 3.22KK170 pKa = 8.69TTIQSLNSQIIRR182 pKa = 11.84LNNDD186 pKa = 2.68VANAQQLLTVSEE198 pKa = 4.38IGLAASIFVGLIGLVVCMVPGAQGIGVGIIIFGIAGLGASIAGTVVFSKK247 pKa = 10.49EE248 pKa = 4.02VQDD251 pKa = 4.12LQNSINSLQGQVSGINQDD269 pKa = 3.59IIQLQGVSGQINALQAASVQAVQALSTISGMWSQLDD305 pKa = 3.6AAIGAVAAEE314 pKa = 4.51LDD316 pKa = 4.21DD317 pKa = 4.09VNNDD321 pKa = 2.66ITSEE325 pKa = 4.06QFKK328 pKa = 10.47QALSDD333 pKa = 3.73FQAAEE338 pKa = 4.22ANWTDD343 pKa = 3.63VITFATSLANINYY356 pKa = 9.04SWQDD360 pKa = 3.13SSGTWHH366 pKa = 7.38HH367 pKa = 6.8YY368 pKa = 7.29GTQNPAADD376 pKa = 4.03NGQVTAIPSSQAVAA390 pKa = 3.54
MM1 pKa = 7.44KK2 pKa = 10.59NSARR6 pKa = 11.84LVALQPTPQQLTDD19 pKa = 3.54YY20 pKa = 9.98ANALIVVNSYY30 pKa = 9.36TYY32 pKa = 10.94AVEE35 pKa = 4.08NQQLPTLNAPPTNYY49 pKa = 10.58ADD51 pKa = 5.19FISAFNPVKK60 pKa = 10.59SSAINWSEE68 pKa = 4.14TIFPSITTLPAHH80 pKa = 7.5IINYY84 pKa = 9.69AGSLFNLEE92 pKa = 4.07EE93 pKa = 4.18TLVTGYY99 pKa = 11.33LNILINDD106 pKa = 4.51PGNVAARR113 pKa = 11.84NGLVATLTNMQQTIQAEE130 pKa = 4.58LNFVTDD136 pKa = 3.3IQSNLTAFTTDD147 pKa = 2.98TQTAGQTLQQLAQQALSMAGADD169 pKa = 3.22KK170 pKa = 8.69TTIQSLNSQIIRR182 pKa = 11.84LNNDD186 pKa = 2.68VANAQQLLTVSEE198 pKa = 4.38IGLAASIFVGLIGLVVCMVPGAQGIGVGIIIFGIAGLGASIAGTVVFSKK247 pKa = 10.49EE248 pKa = 4.02VQDD251 pKa = 4.12LQNSINSLQGQVSGINQDD269 pKa = 3.59IIQLQGVSGQINALQAASVQAVQALSTISGMWSQLDD305 pKa = 3.6AAIGAVAAEE314 pKa = 4.51LDD316 pKa = 4.21DD317 pKa = 4.09VNNDD321 pKa = 2.66ITSEE325 pKa = 4.06QFKK328 pKa = 10.47QALSDD333 pKa = 3.73FQAAEE338 pKa = 4.22ANWTDD343 pKa = 3.63VITFATSLANINYY356 pKa = 9.04SWQDD360 pKa = 3.13SSGTWHH366 pKa = 7.38HH367 pKa = 6.8YY368 pKa = 7.29GTQNPAADD376 pKa = 4.03NGQVTAIPSSQAVAA390 pKa = 3.54
Molecular weight: 41.12 kDa
Isoelectric point according different methods:
Protein with the highest isoelectric point:
>tr|A0A1M6WBX4|A0A1M6WBX4_9BACT Muramoyltetrapeptide carboxypeptidase OS=Chitinophaga jiangningensis OX=1419482 GN=SAMN05444266_101565 PE=3 SV=1
MM1 pKa = 6.88MQDD4 pKa = 3.46EE5 pKa = 4.55QNKK8 pKa = 8.02RR9 pKa = 11.84TDD11 pKa = 2.87NRR13 pKa = 11.84YY14 pKa = 9.35RR15 pKa = 11.84PIGEE19 pKa = 4.08LVRR22 pKa = 11.84GLFFILFGLFAIFARR37 pKa = 11.84QLGLGEE43 pKa = 4.63FRR45 pKa = 11.84LSPQWMTILGVVLCIYY61 pKa = 10.99GLFRR65 pKa = 11.84VINGARR71 pKa = 11.84KK72 pKa = 9.62LFF74 pKa = 3.93
MM1 pKa = 6.88MQDD4 pKa = 3.46EE5 pKa = 4.55QNKK8 pKa = 8.02RR9 pKa = 11.84TDD11 pKa = 2.87NRR13 pKa = 11.84YY14 pKa = 9.35RR15 pKa = 11.84PIGEE19 pKa = 4.08LVRR22 pKa = 11.84GLFFILFGLFAIFARR37 pKa = 11.84QLGLGEE43 pKa = 4.63FRR45 pKa = 11.84LSPQWMTILGVVLCIYY61 pKa = 10.99GLFRR65 pKa = 11.84VINGARR71 pKa = 11.84KK72 pKa = 9.62LFF74 pKa = 3.93
Molecular weight: 8.66 kDa
Isoelectric point according different methods:
Peptides (in silico digests for buttom-up proteomics)
Below you can find in silico digests of the whole proteome with Trypsin, Chymotrypsin, Trypsin+LysC, LysN, ArgC proteases suitable for different mass spec machines.| Try ESI |
 |
|---|
| ChTry ESI |
 |
|---|
| ArgC ESI |
 |
|---|
| LysN ESI |
 |
|---|
| TryLysC ESI |
 |
|---|
| Try MALDI |
 |
|---|
| ChTry MALDI |
 |
|---|
| ArgC MALDI |
 |
|---|
| LysN MALDI |
 |
|---|
| TryLysC MALDI |
 |
|---|
| Try LTQ |
 |
|---|
| ChTry LTQ |
 |
|---|
| ArgC LTQ |
 |
|---|
| LysN LTQ |
 |
|---|
| TryLysC LTQ |
 |
|---|
| Try MSlow |
 |
|---|
| ChTry MSlow |
 |
|---|
| ArgC MSlow |
 |
|---|
| LysN MSlow |
 |
|---|
| TryLysC MSlow |
 |
|---|
| Try MShigh |
 |
|---|
| ChTry MShigh |
 |
|---|
| ArgC MShigh |
 |
|---|
| LysN MShigh |
 |
|---|
| TryLysC MShigh |
 |
|---|
General Statistics
Number of major isoforms |
Number of additional isoforms |
Number of all proteins |
Number of amino acids |
Min. Seq. Length |
Max. Seq. Length |
Avg. Seq. Length |
Avg. Mol. Weight |
|---|---|---|---|---|---|---|---|
0 |
2166146 |
29 |
4281 |
374.6 |
41.79 |
Amino acid frequency
Ala |
Cys |
Asp |
Glu |
Phe |
Gly |
His |
Ile |
Lys |
Leu |
|---|---|---|---|---|---|---|---|---|---|
8.439 ± 0.036 | 0.814 ± 0.012 |
5.191 ± 0.023 | 5.204 ± 0.04 |
4.486 ± 0.025 | 7.079 ± 0.035 |
1.949 ± 0.018 | 6.456 ± 0.025 |
6.012 ± 0.036 | 9.385 ± 0.044 |
Met |
Asn |
Gln |
Pro |
Arg |
Ser |
Thr |
Val |
Trp |
Tyr |
|---|---|---|---|---|---|---|---|---|---|
2.471 ± 0.019 | 5.365 ± 0.037 |
4.266 ± 0.019 | 4.14 ± 0.018 |
4.311 ± 0.022 | 5.994 ± 0.028 |
6.309 ± 0.054 | 6.574 ± 0.026 |
1.325 ± 0.013 | 4.23 ± 0.021 |
Most of the basic statistics you can see at this page can be downloaded from this CSV file
Proteome-pI is available under Creative Commons Attribution-NoDerivs license, for more details see here
| Reference: Kozlowski LP. Proteome-pI 2.0: Proteome Isoelectric Point Database Update. Nucleic Acids Res. 2021, doi: 10.1093/nar/gkab944 | Contact: Lukasz P. Kozlowski |
