Facklamia tabacinasalis
Taxonomy: cellular organisms; Bacteria; Terrabacteria group; Firmicutes; Bacilli; Lactobacillales; Aerococcaceae;
Average proteome isoelectric point is 5.69
Get precalculated fractions of proteins

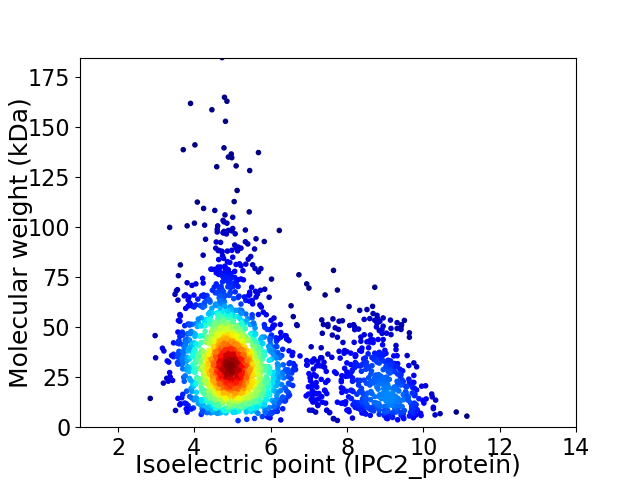
Virtual 2D-PAGE plot for 2319 proteins (isoelectric point calculated using IPC2_protein)
Get csv file with sequences according to given criteria:
* You can choose from 21 different methods for calculating isoelectric point
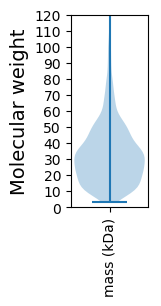
Summary statistics related to proteome-wise predictions


Protein with the lowest isoelectric point:
>tr|A0A5R9DV39|A0A5R9DV39_9LACT Alanine racemase OS=Facklamia tabacinasalis OX=87458 GN=alr PE=3 SV=1
MM1 pKa = 7.57KK2 pKa = 10.44KK3 pKa = 9.93HH4 pKa = 6.21IKK6 pKa = 10.29LLLFSLSLFLLFVPQTRR23 pKa = 11.84PKK25 pKa = 11.03AEE27 pKa = 3.74VSLDD31 pKa = 3.55EE32 pKa = 4.53FVGEE36 pKa = 4.34TVTIGTVGEE45 pKa = 4.06EE46 pKa = 4.58LADD49 pKa = 2.98IWEE52 pKa = 4.57FVADD56 pKa = 4.24KK57 pKa = 10.65AAEE60 pKa = 4.26DD61 pKa = 4.74GIEE64 pKa = 3.92LDD66 pKa = 3.47IVLFTDD72 pKa = 3.63YY73 pKa = 8.46NTPNISLVDD82 pKa = 3.9GSLDD86 pKa = 3.32MNAYY90 pKa = 9.27QHH92 pKa = 6.68TDD94 pKa = 4.01FLNDD98 pKa = 3.12WNDD101 pKa = 3.42ANEE104 pKa = 4.21TNLVSIGNTFATPLRR119 pKa = 11.84FFSEE123 pKa = 4.1KK124 pKa = 10.39HH125 pKa = 5.52NSIDD129 pKa = 4.41DD130 pKa = 4.04LPEE133 pKa = 3.85GAIIAIPNDD142 pKa = 3.7LASSSYY148 pKa = 11.2ALQILDD154 pKa = 3.65YY155 pKa = 11.09ADD157 pKa = 4.04LVKK160 pKa = 10.6LDD162 pKa = 4.17EE163 pKa = 5.72SIDD166 pKa = 3.75ALPTVNDD173 pKa = 3.15IVEE176 pKa = 4.27NPNNYY181 pKa = 10.06EE182 pKa = 4.07IIEE185 pKa = 4.27LEE187 pKa = 4.0AAQIPSAMADD197 pKa = 2.72VDD199 pKa = 3.66MGVIHH204 pKa = 6.26QVYY207 pKa = 10.25LEE209 pKa = 4.23STDD212 pKa = 4.84FEE214 pKa = 5.15PNDD217 pKa = 4.13AIYY220 pKa = 10.39SYY222 pKa = 11.14GHH224 pKa = 5.05NTEE227 pKa = 3.94TFNYY231 pKa = 9.7NRR233 pKa = 11.84LNTITVRR240 pKa = 11.84EE241 pKa = 4.03EE242 pKa = 3.95DD243 pKa = 3.31QGNPLYY249 pKa = 10.64QYY251 pKa = 10.74IVDD254 pKa = 5.32LYY256 pKa = 11.2QSDD259 pKa = 4.58DD260 pKa = 3.42VADD263 pKa = 4.25YY264 pKa = 11.0IEE266 pKa = 5.03EE267 pKa = 4.1ISNGGHH273 pKa = 5.05IPAWILLEE281 pKa = 4.23EE282 pKa = 4.54YY283 pKa = 9.16EE284 pKa = 4.75ASLEE288 pKa = 4.08NEE290 pKa = 4.3RR291 pKa = 11.84NN292 pKa = 3.44
MM1 pKa = 7.57KK2 pKa = 10.44KK3 pKa = 9.93HH4 pKa = 6.21IKK6 pKa = 10.29LLLFSLSLFLLFVPQTRR23 pKa = 11.84PKK25 pKa = 11.03AEE27 pKa = 3.74VSLDD31 pKa = 3.55EE32 pKa = 4.53FVGEE36 pKa = 4.34TVTIGTVGEE45 pKa = 4.06EE46 pKa = 4.58LADD49 pKa = 2.98IWEE52 pKa = 4.57FVADD56 pKa = 4.24KK57 pKa = 10.65AAEE60 pKa = 4.26DD61 pKa = 4.74GIEE64 pKa = 3.92LDD66 pKa = 3.47IVLFTDD72 pKa = 3.63YY73 pKa = 8.46NTPNISLVDD82 pKa = 3.9GSLDD86 pKa = 3.32MNAYY90 pKa = 9.27QHH92 pKa = 6.68TDD94 pKa = 4.01FLNDD98 pKa = 3.12WNDD101 pKa = 3.42ANEE104 pKa = 4.21TNLVSIGNTFATPLRR119 pKa = 11.84FFSEE123 pKa = 4.1KK124 pKa = 10.39HH125 pKa = 5.52NSIDD129 pKa = 4.41DD130 pKa = 4.04LPEE133 pKa = 3.85GAIIAIPNDD142 pKa = 3.7LASSSYY148 pKa = 11.2ALQILDD154 pKa = 3.65YY155 pKa = 11.09ADD157 pKa = 4.04LVKK160 pKa = 10.6LDD162 pKa = 4.17EE163 pKa = 5.72SIDD166 pKa = 3.75ALPTVNDD173 pKa = 3.15IVEE176 pKa = 4.27NPNNYY181 pKa = 10.06EE182 pKa = 4.07IIEE185 pKa = 4.27LEE187 pKa = 4.0AAQIPSAMADD197 pKa = 2.72VDD199 pKa = 3.66MGVIHH204 pKa = 6.26QVYY207 pKa = 10.25LEE209 pKa = 4.23STDD212 pKa = 4.84FEE214 pKa = 5.15PNDD217 pKa = 4.13AIYY220 pKa = 10.39SYY222 pKa = 11.14GHH224 pKa = 5.05NTEE227 pKa = 3.94TFNYY231 pKa = 9.7NRR233 pKa = 11.84LNTITVRR240 pKa = 11.84EE241 pKa = 4.03EE242 pKa = 3.95DD243 pKa = 3.31QGNPLYY249 pKa = 10.64QYY251 pKa = 10.74IVDD254 pKa = 5.32LYY256 pKa = 11.2QSDD259 pKa = 4.58DD260 pKa = 3.42VADD263 pKa = 4.25YY264 pKa = 11.0IEE266 pKa = 5.03EE267 pKa = 4.1ISNGGHH273 pKa = 5.05IPAWILLEE281 pKa = 4.23EE282 pKa = 4.54YY283 pKa = 9.16EE284 pKa = 4.75ASLEE288 pKa = 4.08NEE290 pKa = 4.3RR291 pKa = 11.84NN292 pKa = 3.44
Molecular weight: 32.86 kDa
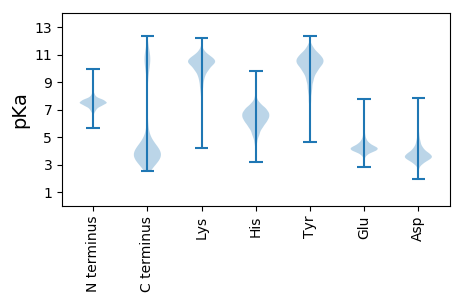
Isoelectric point according different methods:
Protein with the highest isoelectric point:
>tr|A0A5R9EN85|A0A5R9EN85_9LACT 6-phospho-beta-glucosidase OS=Facklamia tabacinasalis OX=87458 GN=FEZ33_02775 PE=3 SV=1
MM1 pKa = 7.62TKK3 pKa = 9.13RR4 pKa = 11.84TYY6 pKa = 9.74QPKK9 pKa = 8.54KK10 pKa = 7.82RR11 pKa = 11.84KK12 pKa = 9.02RR13 pKa = 11.84SRR15 pKa = 11.84VHH17 pKa = 6.41GFRR20 pKa = 11.84KK21 pKa = 10.02RR22 pKa = 11.84MSTKK26 pKa = 10.14NGRR29 pKa = 11.84NVLKK33 pKa = 10.48RR34 pKa = 11.84RR35 pKa = 11.84RR36 pKa = 11.84LKK38 pKa = 10.51GRR40 pKa = 11.84KK41 pKa = 9.06KK42 pKa = 10.22ISAA45 pKa = 3.72
MM1 pKa = 7.62TKK3 pKa = 9.13RR4 pKa = 11.84TYY6 pKa = 9.74QPKK9 pKa = 8.54KK10 pKa = 7.82RR11 pKa = 11.84KK12 pKa = 9.02RR13 pKa = 11.84SRR15 pKa = 11.84VHH17 pKa = 6.41GFRR20 pKa = 11.84KK21 pKa = 10.02RR22 pKa = 11.84MSTKK26 pKa = 10.14NGRR29 pKa = 11.84NVLKK33 pKa = 10.48RR34 pKa = 11.84RR35 pKa = 11.84RR36 pKa = 11.84LKK38 pKa = 10.51GRR40 pKa = 11.84KK41 pKa = 9.06KK42 pKa = 10.22ISAA45 pKa = 3.72
Molecular weight: 5.53 kDa
Isoelectric point according different methods:
Peptides (in silico digests for buttom-up proteomics)
Below you can find in silico digests of the whole proteome with Trypsin, Chymotrypsin, Trypsin+LysC, LysN, ArgC proteases suitable for different mass spec machines.| Try ESI |
 |
|---|
| ChTry ESI |
 |
|---|
| ArgC ESI |
 |
|---|
| LysN ESI |
 |
|---|
| TryLysC ESI |
 |
|---|
| Try MALDI |
 |
|---|
| ChTry MALDI |
 |
|---|
| ArgC MALDI |
 |
|---|
| LysN MALDI |
 |
|---|
| TryLysC MALDI |
 |
|---|
| Try LTQ |
 |
|---|
| ChTry LTQ |
 |
|---|
| ArgC LTQ |
 |
|---|
| LysN LTQ |
 |
|---|
| TryLysC LTQ |
 |
|---|
| Try MSlow |
 |
|---|
| ChTry MSlow |
 |
|---|
| ArgC MSlow |
 |
|---|
| LysN MSlow |
 |
|---|
| TryLysC MSlow |
 |
|---|
| Try MShigh |
 |
|---|
| ChTry MShigh |
 |
|---|
| ArgC MShigh |
 |
|---|
| LysN MShigh |
 |
|---|
| TryLysC MShigh |
 |
|---|
General Statistics
Number of major isoforms |
Number of additional isoforms |
Number of all proteins |
Number of amino acids |
Min. Seq. Length |
Max. Seq. Length |
Avg. Seq. Length |
Avg. Mol. Weight |
|---|---|---|---|---|---|---|---|
0 |
704389 |
29 |
1668 |
303.7 |
34.17 |
Amino acid frequency
Ala |
Cys |
Asp |
Glu |
Phe |
Gly |
His |
Ile |
Lys |
Leu |
|---|---|---|---|---|---|---|---|---|---|
6.814 ± 0.051 | 0.412 ± 0.011 |
6.004 ± 0.046 | 7.987 ± 0.065 |
4.377 ± 0.037 | 6.358 ± 0.044 |
1.911 ± 0.026 | 8.087 ± 0.057 |
5.705 ± 0.051 | 9.479 ± 0.05 |
Met |
Asn |
Gln |
Pro |
Arg |
Ser |
Thr |
Val |
Trp |
Tyr |
|---|---|---|---|---|---|---|---|---|---|
2.619 ± 0.023 | 5.261 ± 0.037 |
3.346 ± 0.025 | 4.043 ± 0.038 |
3.893 ± 0.04 | 6.253 ± 0.039 |
5.729 ± 0.036 | 6.947 ± 0.038 |
0.875 ± 0.017 | 3.899 ± 0.038 |
Most of the basic statistics you can see at this page can be downloaded from this CSV file
Proteome-pI is available under Creative Commons Attribution-NoDerivs license, for more details see here
| Reference: Kozlowski LP. Proteome-pI 2.0: Proteome Isoelectric Point Database Update. Nucleic Acids Res. 2021, doi: 10.1093/nar/gkab944 | Contact: Lukasz P. Kozlowski |
