Pneumocystis jirovecii (strain SE8) (Human pneumocystis pneumonia agent)
Taxonomy: cellular organisms; Eukaryota; Opisthokonta; Fungi; Dikarya; Ascomycota; Taphrinomycotina; Pneumocystidomycetes; Pneumocystidales; Pneumocystidaceae; Pneumocystis; Pneumocystis jirovecii
Average proteome isoelectric point is 6.98
Get precalculated fractions of proteins

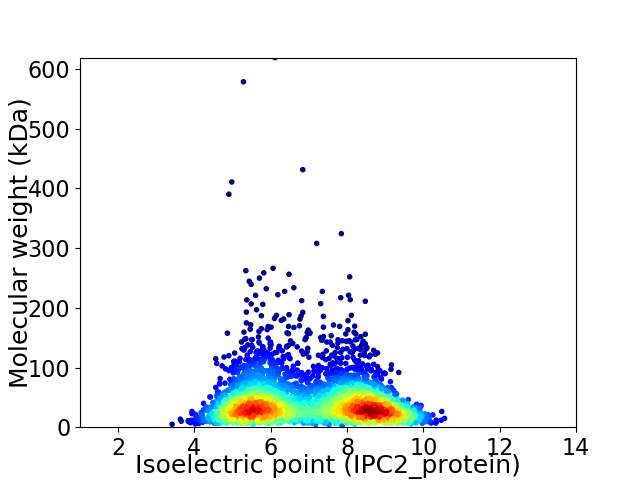
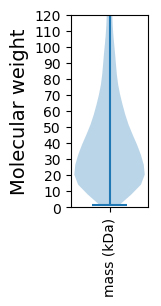
Virtual 2D-PAGE plot for 3419 proteins (isoelectric point calculated using IPC2_protein)
Get csv file with sequences according to given criteria:
* You can choose from 21 different methods for calculating isoelectric point
Summary statistics related to proteome-wise predictions


Protein with the lowest isoelectric point:
>tr|L0P9B4|L0P9B4_PNEJ8 Uncharacterized protein OS=Pneumocystis jirovecii (strain SE8) OX=1209962 GN=PNEJI1_002589 PE=3 SV=1
MM1 pKa = 7.43SFYY4 pKa = 11.25DD5 pKa = 4.0EE6 pKa = 5.34IEE8 pKa = 4.56IEE10 pKa = 5.03DD11 pKa = 3.75FTFDD15 pKa = 3.35TEE17 pKa = 4.2LQIYY21 pKa = 8.98HH22 pKa = 5.9YY23 pKa = 9.19PCPCGDD29 pKa = 3.35RR30 pKa = 11.84FEE32 pKa = 5.82ISLNDD37 pKa = 3.47LRR39 pKa = 11.84KK40 pKa = 9.65GDD42 pKa = 4.37EE43 pKa = 3.73IAYY46 pKa = 9.97CPSCSLMVRR55 pKa = 11.84VIYY58 pKa = 10.58DD59 pKa = 3.06QDD61 pKa = 3.41KK62 pKa = 10.55FLEE65 pKa = 4.34NDD67 pKa = 4.14DD68 pKa = 4.82EE69 pKa = 5.89ISLQSAPVIVVV80 pKa = 3.47
MM1 pKa = 7.43SFYY4 pKa = 11.25DD5 pKa = 4.0EE6 pKa = 5.34IEE8 pKa = 4.56IEE10 pKa = 5.03DD11 pKa = 3.75FTFDD15 pKa = 3.35TEE17 pKa = 4.2LQIYY21 pKa = 8.98HH22 pKa = 5.9YY23 pKa = 9.19PCPCGDD29 pKa = 3.35RR30 pKa = 11.84FEE32 pKa = 5.82ISLNDD37 pKa = 3.47LRR39 pKa = 11.84KK40 pKa = 9.65GDD42 pKa = 4.37EE43 pKa = 3.73IAYY46 pKa = 9.97CPSCSLMVRR55 pKa = 11.84VIYY58 pKa = 10.58DD59 pKa = 3.06QDD61 pKa = 3.41KK62 pKa = 10.55FLEE65 pKa = 4.34NDD67 pKa = 4.14DD68 pKa = 4.82EE69 pKa = 5.89ISLQSAPVIVVV80 pKa = 3.47
Molecular weight: 9.35 kDa
Isoelectric point according different methods:
Protein with the highest isoelectric point:
>tr|L0P9M7|L0P9M7_PNEJ8 Rab-GAP TBC domain-containing protein OS=Pneumocystis jirovecii (strain SE8) OX=1209962 GN=PNEJI1_001984 PE=4 SV=1
MM1 pKa = 7.9PGPTVSRR8 pKa = 11.84RR9 pKa = 11.84SSRR12 pKa = 11.84LTVLKK17 pKa = 10.94NSGGKK22 pKa = 9.27FLPALFYY29 pKa = 11.32SPVSLIFPVFFPPFPPLSDD48 pKa = 3.93PSADD52 pKa = 3.43APQDD56 pKa = 3.48IQQHH60 pKa = 5.59RR61 pKa = 11.84KK62 pKa = 9.43GLPASPKK69 pKa = 9.52EE70 pKa = 3.94RR71 pKa = 11.84LPPFQDD77 pKa = 3.02GCPPRR82 pKa = 11.84RR83 pKa = 11.84PPRR86 pKa = 11.84RR87 pKa = 11.84QHH89 pKa = 5.94RR90 pKa = 11.84RR91 pKa = 11.84ALAPYY96 pKa = 8.77CINVSIATTTDD107 pKa = 2.91ASDD110 pKa = 3.58VGGDD114 pKa = 2.97WRR116 pKa = 11.84DD117 pKa = 2.94ARR119 pKa = 11.84EE120 pKa = 3.97RR121 pKa = 11.84GRR123 pKa = 11.84QRR125 pKa = 11.84GDD127 pKa = 2.77GRR129 pKa = 11.84RR130 pKa = 11.84CQYY133 pKa = 9.55TQGLCAPRR141 pKa = 11.84PVDD144 pKa = 3.44ALHH147 pKa = 6.19EE148 pKa = 4.21QRR150 pKa = 11.84GCPPCNRR157 pKa = 11.84VCPVLHH163 pKa = 6.75
MM1 pKa = 7.9PGPTVSRR8 pKa = 11.84RR9 pKa = 11.84SSRR12 pKa = 11.84LTVLKK17 pKa = 10.94NSGGKK22 pKa = 9.27FLPALFYY29 pKa = 11.32SPVSLIFPVFFPPFPPLSDD48 pKa = 3.93PSADD52 pKa = 3.43APQDD56 pKa = 3.48IQQHH60 pKa = 5.59RR61 pKa = 11.84KK62 pKa = 9.43GLPASPKK69 pKa = 9.52EE70 pKa = 3.94RR71 pKa = 11.84LPPFQDD77 pKa = 3.02GCPPRR82 pKa = 11.84RR83 pKa = 11.84PPRR86 pKa = 11.84RR87 pKa = 11.84QHH89 pKa = 5.94RR90 pKa = 11.84RR91 pKa = 11.84ALAPYY96 pKa = 8.77CINVSIATTTDD107 pKa = 2.91ASDD110 pKa = 3.58VGGDD114 pKa = 2.97WRR116 pKa = 11.84DD117 pKa = 2.94ARR119 pKa = 11.84EE120 pKa = 3.97RR121 pKa = 11.84GRR123 pKa = 11.84QRR125 pKa = 11.84GDD127 pKa = 2.77GRR129 pKa = 11.84RR130 pKa = 11.84CQYY133 pKa = 9.55TQGLCAPRR141 pKa = 11.84PVDD144 pKa = 3.44ALHH147 pKa = 6.19EE148 pKa = 4.21QRR150 pKa = 11.84GCPPCNRR157 pKa = 11.84VCPVLHH163 pKa = 6.75
Molecular weight: 18.11 kDa
Isoelectric point according different methods:
Peptides (in silico digests for buttom-up proteomics)
Below you can find in silico digests of the whole proteome with Trypsin, Chymotrypsin, Trypsin+LysC, LysN, ArgC proteases suitable for different mass spec machines.| Try ESI |
 |
|---|
| ChTry ESI |
 |
|---|
| ArgC ESI |
 |
|---|
| LysN ESI |
 |
|---|
| TryLysC ESI |
 |
|---|
| Try MALDI |
 |
|---|
| ChTry MALDI |
 |
|---|
| ArgC MALDI |
 |
|---|
| LysN MALDI |
 |
|---|
| TryLysC MALDI |
 |
|---|
| Try LTQ |
 |
|---|
| ChTry LTQ |
 |
|---|
| ArgC LTQ |
 |
|---|
| LysN LTQ |
 |
|---|
| TryLysC LTQ |
 |
|---|
| Try MSlow |
 |
|---|
| ChTry MSlow |
 |
|---|
| ArgC MSlow |
 |
|---|
| LysN MSlow |
 |
|---|
| TryLysC MSlow |
 |
|---|
| Try MShigh |
 |
|---|
| ChTry MShigh |
 |
|---|
| ArgC MShigh |
 |
|---|
| LysN MShigh |
 |
|---|
| TryLysC MShigh |
 |
|---|
General Statistics
Number of major isoforms |
Number of additional isoforms |
Number of all proteins |
Number of amino acids |
Min. Seq. Length |
Max. Seq. Length |
Avg. Seq. Length |
Avg. Mol. Weight |
|---|---|---|---|---|---|---|---|
0 |
1381820 |
13 |
5307 |
404.2 |
46.31 |
Amino acid frequency
Ala |
Cys |
Asp |
Glu |
Phe |
Gly |
His |
Ile |
Lys |
Leu |
|---|---|---|---|---|---|---|---|---|---|
4.615 ± 0.034 | 1.541 ± 0.015 |
5.414 ± 0.027 | 6.782 ± 0.037 |
4.768 ± 0.029 | 4.426 ± 0.036 |
2.302 ± 0.016 | 8.327 ± 0.049 |
8.076 ± 0.043 | 9.772 ± 0.04 |
Met |
Asn |
Gln |
Pro |
Arg |
Ser |
Thr |
Val |
Trp |
Tyr |
|---|---|---|---|---|---|---|---|---|---|
2.141 ± 0.016 | 6.036 ± 0.034 |
3.786 ± 0.028 | 3.762 ± 0.028 |
4.471 ± 0.032 | 8.697 ± 0.045 |
5.203 ± 0.027 | 5.073 ± 0.033 |
1.106 ± 0.012 | 3.702 ± 0.022 |
Most of the basic statistics you can see at this page can be downloaded from this CSV file
Proteome-pI is available under Creative Commons Attribution-NoDerivs license, for more details see here
| Reference: Kozlowski LP. Proteome-pI 2.0: Proteome Isoelectric Point Database Update. Nucleic Acids Res. 2021, doi: 10.1093/nar/gkab944 | Contact: Lukasz P. Kozlowski |
