Paenibacillus phage phiIBB_Pl23
Taxonomy: Viruses; Duplodnaviria; Heunggongvirae; Uroviricota; Caudoviricetes; Caudovirales; Siphoviridae; Fernvirus; Paenibacillus virus P123
Average proteome isoelectric point is 6.4
Get precalculated fractions of proteins

Virtual 2D-PAGE plot for 68 proteins (isoelectric point calculated using IPC2_protein)
Get csv file with sequences according to given criteria:
* You can choose from 21 different methods for calculating isoelectric point
Summary statistics related to proteome-wise predictions


Protein with the lowest isoelectric point:
>tr|R9W0R1|R9W0R1_9CAUD HicB-like domain-containing protein OS=Paenibacillus phage phiIBB_Pl23 OX=1337877 GN=IBBPl23_62 PE=4 SV=1
MM1 pKa = 7.38TKK3 pKa = 10.06QYY5 pKa = 9.8WCEE8 pKa = 3.69EE9 pKa = 4.11CQNFVDD15 pKa = 3.92EE16 pKa = 4.72HH17 pKa = 6.89VVTNGIHH24 pKa = 6.84DD25 pKa = 3.74EE26 pKa = 4.51CGQEE30 pKa = 4.11VNIEE34 pKa = 4.05EE35 pKa = 4.59NEE37 pKa = 3.95EE38 pKa = 4.06DD39 pKa = 4.68DD40 pKa = 4.71LL41 pKa = 6.61
MM1 pKa = 7.38TKK3 pKa = 10.06QYY5 pKa = 9.8WCEE8 pKa = 3.69EE9 pKa = 4.11CQNFVDD15 pKa = 3.92EE16 pKa = 4.72HH17 pKa = 6.89VVTNGIHH24 pKa = 6.84DD25 pKa = 3.74EE26 pKa = 4.51CGQEE30 pKa = 4.11VNIEE34 pKa = 4.05EE35 pKa = 4.59NEE37 pKa = 3.95EE38 pKa = 4.06DD39 pKa = 4.68DD40 pKa = 4.71LL41 pKa = 6.61
Molecular weight: 4.87 kDa
Isoelectric point according different methods:
Protein with the highest isoelectric point:
>tr|R9W0P2|R9W0P2_9CAUD HTH cro/C1-type domain-containing protein OS=Paenibacillus phage phiIBB_Pl23 OX=1337877 GN=IBBPl23_32 PE=4 SV=1
MM1 pKa = 6.96KK2 pKa = 9.84TVLFHH7 pKa = 5.99VLSMFNRR14 pKa = 11.84VIINFAFRR22 pKa = 11.84SGGSNEE28 pKa = 4.36RR29 pKa = 11.84GINTYY34 pKa = 8.55NNRR37 pKa = 11.84EE38 pKa = 3.71GHH40 pKa = 5.64YY41 pKa = 10.67LSS43 pKa = 4.67
MM1 pKa = 6.96KK2 pKa = 9.84TVLFHH7 pKa = 5.99VLSMFNRR14 pKa = 11.84VIINFAFRR22 pKa = 11.84SGGSNEE28 pKa = 4.36RR29 pKa = 11.84GINTYY34 pKa = 8.55NNRR37 pKa = 11.84EE38 pKa = 3.71GHH40 pKa = 5.64YY41 pKa = 10.67LSS43 pKa = 4.67
Molecular weight: 4.99 kDa
Isoelectric point according different methods:
Peptides (in silico digests for buttom-up proteomics)
Below you can find in silico digests of the whole proteome with Trypsin, Chymotrypsin, Trypsin+LysC, LysN, ArgC proteases suitable for different mass spec machines.| Try ESI |
 |
|---|
| ChTry ESI |
|
|---|
| ArgC ESI |
|
|---|
| LysN ESI |
|
|---|
| TryLysC ESI |
|
|---|
| Try MALDI |
|
|---|
| ChTry MALDI |
|
|---|
| ArgC MALDI |
|
|---|
| LysN MALDI |
|
|---|
| TryLysC MALDI |
|
|---|
| Try LTQ |
|
|---|
| ChTry LTQ |
|
|---|
| ArgC LTQ |
|
|---|
| LysN LTQ |
|
|---|
| TryLysC LTQ |
|
|---|
| Try MSlow |
|
|---|
| ChTry MSlow |
|
|---|
| ArgC MSlow |
|
|---|
| LysN MSlow |
|
|---|
| TryLysC MSlow |
|
|---|
| Try MShigh |
|
|---|
| ChTry MShigh |
|
|---|
| ArgC MShigh |
|
|---|
| LysN MShigh |
|
|---|
| TryLysC MShigh |
|
|---|
General Statistics
Number of major isoforms |
Number of additional isoforms |
Number of all proteins |
Number of amino acids |
Min. Seq. Length |
Max. Seq. Length |
Avg. Seq. Length |
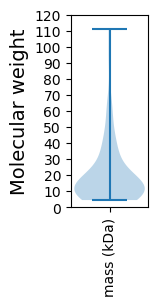
Avg. Mol. Weight |
|---|---|---|---|---|---|---|---|
0 |
12525 |
39 |
975 |
184.2 |
21.02 |
Amino acid frequency
Ala |
Cys |
Asp |
Glu |
Phe |
Gly |
His |
Ile |
Lys |
Leu |
|---|---|---|---|---|---|---|---|---|---|
6.267 ± 0.507 | 1.126 ± 0.189 |
5.9 ± 0.278 | 8.487 ± 0.44 |
3.792 ± 0.181 | 6.084 ± 0.308 |
1.876 ± 0.169 | 7.026 ± 0.265 |
8.535 ± 0.31 | 8.144 ± 0.258 |
Met |
Asn |
Gln |
Pro |
Arg |
Ser |
Thr |
Val |
Trp |
Tyr |
|---|---|---|---|---|---|---|---|---|---|
2.834 ± 0.206 | 5.062 ± 0.324 |
3.473 ± 0.207 | 4.016 ± 0.187 |
4.743 ± 0.328 | 6.156 ± 0.354 |
5.261 ± 0.243 | 5.948 ± 0.189 |
1.517 ± 0.176 | 3.752 ± 0.223 |
Most of the basic statistics you can see at this page can be downloaded from this CSV file
See this proteome in:

Proteome-pI is available under Creative Commons Attribution-NoDerivs license, for more details see here
| Reference: Kozlowski LP. Proteome-pI 2.0: Proteome Isoelectric Point Database Update. Nucleic Acids Res. 2021, doi: 10.1093/nar/gkab944 | Contact: Lukasz P. Kozlowski |