Bacillus phage PfEFR-4
Taxonomy: Viruses; Duplodnaviria; Heunggongvirae; Uroviricota; Caudoviricetes; Caudovirales; Siphoviridae; Hubeivirus; Bacillus virus PfEFR4
Average proteome isoelectric point is 7.04
Get precalculated fractions of proteins
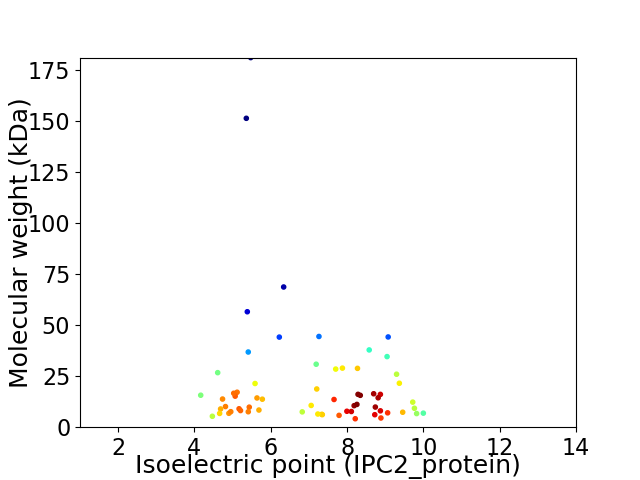
Virtual 2D-PAGE plot for 64 proteins (isoelectric point calculated using IPC2_protein)
Get csv file with sequences according to given criteria:
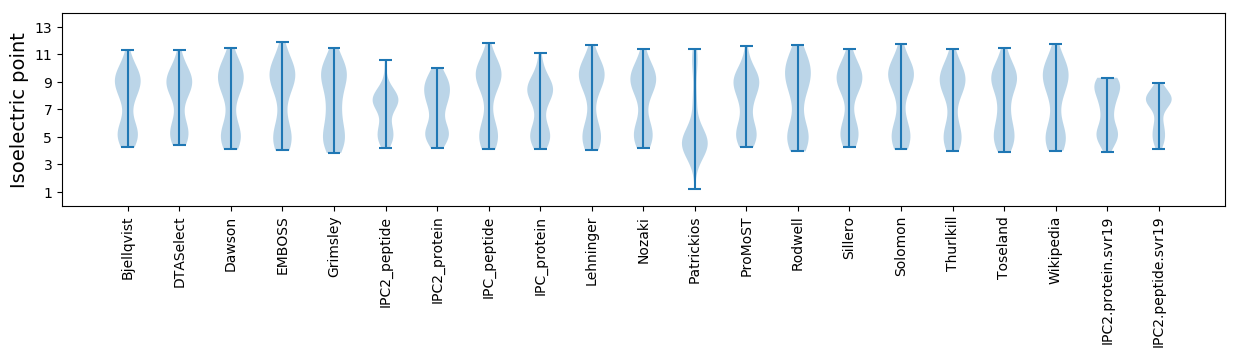
* You can choose from 21 different methods for calculating isoelectric point
Summary statistics related to proteome-wise predictions
Protein with the lowest isoelectric point:
>tr|A0A1B1P7V8|A0A1B1P7V8_9CAUD Uncharacterized protein OS=Bacillus phage PfEFR-4 OX=1868598 PE=4 SV=1
MM1 pKa = 7.42SRR3 pKa = 11.84FKK5 pKa = 10.97FRR7 pKa = 11.84TWDD10 pKa = 3.12KK11 pKa = 10.07KK12 pKa = 10.91AEE14 pKa = 4.06VMEE17 pKa = 4.31QYY19 pKa = 10.65HH20 pKa = 5.92YY21 pKa = 11.16LQLSPIGQLYY31 pKa = 9.63HH32 pKa = 7.92DD33 pKa = 4.85GMNVTDD39 pKa = 4.44NYY41 pKa = 10.93EE42 pKa = 3.73IMQYY46 pKa = 10.09TGLKK50 pKa = 10.05DD51 pKa = 3.95KK52 pKa = 10.8NDD54 pKa = 3.41KK55 pKa = 10.41EE56 pKa = 4.33IYY58 pKa = 9.83EE59 pKa = 4.24GDD61 pKa = 3.02IVRR64 pKa = 11.84YY65 pKa = 9.86LDD67 pKa = 3.56GDD69 pKa = 3.6EE70 pKa = 4.31WSTEE74 pKa = 3.66SGYY77 pKa = 11.15DD78 pKa = 3.45CEE80 pKa = 5.4EE81 pKa = 4.11FDD83 pKa = 3.38NHH85 pKa = 5.89GVIFFDD91 pKa = 4.41EE92 pKa = 4.25EE93 pKa = 3.97CGRR96 pKa = 11.84YY97 pKa = 9.61DD98 pKa = 3.35VTNKK102 pKa = 10.18QGISYY107 pKa = 10.79DD108 pKa = 3.73DD109 pKa = 4.99LFDD112 pKa = 4.81CGVDD116 pKa = 4.28FEE118 pKa = 5.55IIGNIYY124 pKa = 9.85EE125 pKa = 4.17NPEE128 pKa = 4.31LIKK131 pKa = 11.08NN132 pKa = 3.79
MM1 pKa = 7.42SRR3 pKa = 11.84FKK5 pKa = 10.97FRR7 pKa = 11.84TWDD10 pKa = 3.12KK11 pKa = 10.07KK12 pKa = 10.91AEE14 pKa = 4.06VMEE17 pKa = 4.31QYY19 pKa = 10.65HH20 pKa = 5.92YY21 pKa = 11.16LQLSPIGQLYY31 pKa = 9.63HH32 pKa = 7.92DD33 pKa = 4.85GMNVTDD39 pKa = 4.44NYY41 pKa = 10.93EE42 pKa = 3.73IMQYY46 pKa = 10.09TGLKK50 pKa = 10.05DD51 pKa = 3.95KK52 pKa = 10.8NDD54 pKa = 3.41KK55 pKa = 10.41EE56 pKa = 4.33IYY58 pKa = 9.83EE59 pKa = 4.24GDD61 pKa = 3.02IVRR64 pKa = 11.84YY65 pKa = 9.86LDD67 pKa = 3.56GDD69 pKa = 3.6EE70 pKa = 4.31WSTEE74 pKa = 3.66SGYY77 pKa = 11.15DD78 pKa = 3.45CEE80 pKa = 5.4EE81 pKa = 4.11FDD83 pKa = 3.38NHH85 pKa = 5.89GVIFFDD91 pKa = 4.41EE92 pKa = 4.25EE93 pKa = 3.97CGRR96 pKa = 11.84YY97 pKa = 9.61DD98 pKa = 3.35VTNKK102 pKa = 10.18QGISYY107 pKa = 10.79DD108 pKa = 3.73DD109 pKa = 4.99LFDD112 pKa = 4.81CGVDD116 pKa = 4.28FEE118 pKa = 5.55IIGNIYY124 pKa = 9.85EE125 pKa = 4.17NPEE128 pKa = 4.31LIKK131 pKa = 11.08NN132 pKa = 3.79
Molecular weight: 15.67 kDa
Isoelectric point according different methods:
Protein with the highest isoelectric point:
>tr|A0A1B1P7Y2|A0A1B1P7Y2_9CAUD Site-specific integrase OS=Bacillus phage PfEFR-4 OX=1868598 PE=3 SV=1
MM1 pKa = 7.2EE2 pKa = 5.51RR3 pKa = 11.84MRR5 pKa = 11.84HH6 pKa = 3.88TRR8 pKa = 11.84NRR10 pKa = 11.84QMTKK14 pKa = 9.4IGEE17 pKa = 4.17EE18 pKa = 3.7NFMGMKK24 pKa = 9.74NIKK27 pKa = 9.73ISTIRR32 pKa = 11.84KK33 pKa = 9.08FDD35 pKa = 3.56GEE37 pKa = 4.45FNNRR41 pKa = 11.84LDD43 pKa = 3.56PTFRR47 pKa = 11.84WHH49 pKa = 7.54RR50 pKa = 11.84DD51 pKa = 3.27YY52 pKa = 11.54HH53 pKa = 6.99GMNIVSFNRR62 pKa = 11.84KK63 pKa = 9.3GEE65 pKa = 4.0AFKK68 pKa = 11.02TNVIKK73 pKa = 10.88VRR75 pKa = 11.84NN76 pKa = 3.71
MM1 pKa = 7.2EE2 pKa = 5.51RR3 pKa = 11.84MRR5 pKa = 11.84HH6 pKa = 3.88TRR8 pKa = 11.84NRR10 pKa = 11.84QMTKK14 pKa = 9.4IGEE17 pKa = 4.17EE18 pKa = 3.7NFMGMKK24 pKa = 9.74NIKK27 pKa = 9.73ISTIRR32 pKa = 11.84KK33 pKa = 9.08FDD35 pKa = 3.56GEE37 pKa = 4.45FNNRR41 pKa = 11.84LDD43 pKa = 3.56PTFRR47 pKa = 11.84WHH49 pKa = 7.54RR50 pKa = 11.84DD51 pKa = 3.27YY52 pKa = 11.54HH53 pKa = 6.99GMNIVSFNRR62 pKa = 11.84KK63 pKa = 9.3GEE65 pKa = 4.0AFKK68 pKa = 11.02TNVIKK73 pKa = 10.88VRR75 pKa = 11.84NN76 pKa = 3.71
Molecular weight: 9.28 kDa
Isoelectric point according different methods:
Peptides (in silico digests for buttom-up proteomics)
Below you can find in silico digests of the whole proteome with Trypsin, Chymotrypsin, Trypsin+LysC, LysN, ArgC proteases suitable for different mass spec machines.| Try ESI |
 |
|---|
| ChTry ESI |
|
|---|
| ArgC ESI |
|
|---|
| LysN ESI |
|
|---|
| TryLysC ESI |
|
|---|
| Try MALDI |
|
|---|
| ChTry MALDI |
|
|---|
| ArgC MALDI |
|
|---|
| LysN MALDI |
|
|---|
| TryLysC MALDI |
|
|---|
| Try LTQ |
|
|---|
| ChTry LTQ |
|
|---|
| ArgC LTQ |
|
|---|
| LysN LTQ |
|
|---|
| TryLysC LTQ |
|
|---|
| Try MSlow |
|
|---|
| ChTry MSlow |
|
|---|
| ArgC MSlow |
|
|---|
| LysN MSlow |
|
|---|
| TryLysC MSlow |
|
|---|
| Try MShigh |
|
|---|
| ChTry MShigh |
|
|---|
| ArgC MShigh |
|
|---|
| LysN MShigh |
|
|---|
| TryLysC MShigh |
|
|---|
General Statistics
Number of major isoforms |
Number of additional isoforms |
Number of all proteins |
Number of amino acids |
Min. Seq. Length |
Max. Seq. Length |
Avg. Seq. Length |
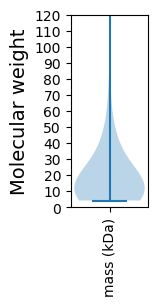
Avg. Mol. Weight |
|---|---|---|---|---|---|---|---|
0 |
12068 |
34 |
1671 |
188.6 |
21.57 |
Amino acid frequency
Ala |
Cys |
Asp |
Glu |
Phe |
Gly |
His |
Ile |
Lys |
Leu |
|---|---|---|---|---|---|---|---|---|---|
6.215 ± 0.598 | 0.746 ± 0.147 |
5.386 ± 0.266 | 8.494 ± 0.284 |
4.035 ± 0.205 | 6.231 ± 0.497 |
1.55 ± 0.166 | 6.969 ± 0.305 |
9.364 ± 0.387 | 7.897 ± 0.308 |
Met |
Asn |
Gln |
Pro |
Arg |
Ser |
Thr |
Val |
Trp |
Tyr |
|---|---|---|---|---|---|---|---|---|---|
3.058 ± 0.179 | 5.37 ± 0.225 |
2.776 ± 0.245 | 4.723 ± 0.428 |
4.881 ± 0.299 | 5.535 ± 0.228 |
5.709 ± 0.273 | 6.198 ± 0.228 |
1.334 ± 0.144 | 3.53 ± 0.27 |
Most of the basic statistics you can see at this page can be downloaded from this CSV file
See this proteome in:

Proteome-pI is available under Creative Commons Attribution-NoDerivs license, for more details see here
| Reference: Kozlowski LP. Proteome-pI 2.0: Proteome Isoelectric Point Database Update. Nucleic Acids Res. 2021, doi: 10.1093/nar/gkab944 | Contact: Lukasz P. Kozlowski |