Dethiosulfovibrio peptidovorans DSM 11002
Taxonomy: cellular organisms; Bacteria; Synergistetes; Synergistia; Synergistales; Synergistaceae; Dethiosulfovibrio; Dethiosulfovibrio peptidovorans
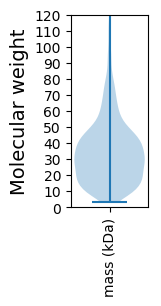
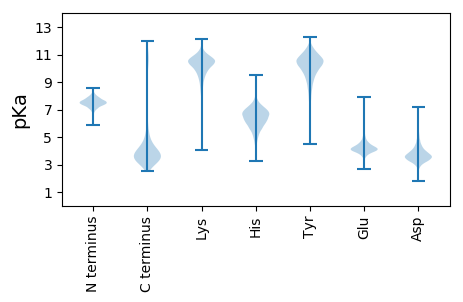
Average proteome isoelectric point is 6.15
Get precalculated fractions of proteins

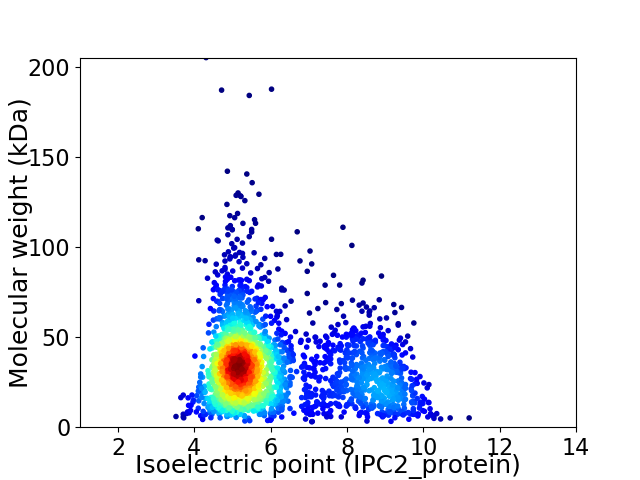
Virtual 2D-PAGE plot for 2432 proteins (isoelectric point calculated using IPC2_protein)
Get csv file with sequences according to given criteria:
* You can choose from 21 different methods for calculating isoelectric point
Summary statistics related to proteome-wise predictions


Protein with the lowest isoelectric point:
>tr|D2Z462|D2Z462_9BACT Dihydroorotase and related cyclic amidohydrolase-like protein OS=Dethiosulfovibrio peptidovorans DSM 11002 OX=469381 GN=Dpep_2301 PE=4 SV=1
MM1 pKa = 7.59SARR4 pKa = 11.84EE5 pKa = 3.8KK6 pKa = 10.14IAYY9 pKa = 9.22IKK11 pKa = 10.83GLLDD15 pKa = 3.96AGTPRR20 pKa = 11.84DD21 pKa = 4.14DD22 pKa = 5.68FEE24 pKa = 4.18MALYY28 pKa = 10.02GAIVEE33 pKa = 4.44ALDD36 pKa = 4.69AVVDD40 pKa = 4.0DD41 pKa = 5.09MDD43 pKa = 4.28RR44 pKa = 11.84QDD46 pKa = 3.63EE47 pKa = 4.54SLVALTEE54 pKa = 3.95EE55 pKa = 5.01LMDD58 pKa = 5.24LSDD61 pKa = 3.87YY62 pKa = 11.3CDD64 pKa = 3.79GLGEE68 pKa = 4.53DD69 pKa = 4.56LDD71 pKa = 5.2AIEE74 pKa = 4.89EE75 pKa = 4.5GWLGEE80 pKa = 4.04RR81 pKa = 11.84VLDD84 pKa = 4.55QEE86 pKa = 4.84DD87 pKa = 3.69VLIAEE92 pKa = 4.53GDD94 pKa = 3.71EE95 pKa = 4.25PEE97 pKa = 5.13GVDD100 pKa = 3.73LYY102 pKa = 11.35RR103 pKa = 11.84PILCPYY109 pKa = 8.66CSTMFYY115 pKa = 10.56YY116 pKa = 10.49RR117 pKa = 11.84PDD119 pKa = 3.52LCDD122 pKa = 3.72EE123 pKa = 4.74NDD125 pKa = 3.55TAQCPNCRR133 pKa = 11.84RR134 pKa = 11.84TFAPSEE140 pKa = 4.22VEE142 pKa = 4.18LEE144 pKa = 4.27EE145 pKa = 4.28EE146 pKa = 4.21
MM1 pKa = 7.59SARR4 pKa = 11.84EE5 pKa = 3.8KK6 pKa = 10.14IAYY9 pKa = 9.22IKK11 pKa = 10.83GLLDD15 pKa = 3.96AGTPRR20 pKa = 11.84DD21 pKa = 4.14DD22 pKa = 5.68FEE24 pKa = 4.18MALYY28 pKa = 10.02GAIVEE33 pKa = 4.44ALDD36 pKa = 4.69AVVDD40 pKa = 4.0DD41 pKa = 5.09MDD43 pKa = 4.28RR44 pKa = 11.84QDD46 pKa = 3.63EE47 pKa = 4.54SLVALTEE54 pKa = 3.95EE55 pKa = 5.01LMDD58 pKa = 5.24LSDD61 pKa = 3.87YY62 pKa = 11.3CDD64 pKa = 3.79GLGEE68 pKa = 4.53DD69 pKa = 4.56LDD71 pKa = 5.2AIEE74 pKa = 4.89EE75 pKa = 4.5GWLGEE80 pKa = 4.04RR81 pKa = 11.84VLDD84 pKa = 4.55QEE86 pKa = 4.84DD87 pKa = 3.69VLIAEE92 pKa = 4.53GDD94 pKa = 3.71EE95 pKa = 4.25PEE97 pKa = 5.13GVDD100 pKa = 3.73LYY102 pKa = 11.35RR103 pKa = 11.84PILCPYY109 pKa = 8.66CSTMFYY115 pKa = 10.56YY116 pKa = 10.49RR117 pKa = 11.84PDD119 pKa = 3.52LCDD122 pKa = 3.72EE123 pKa = 4.74NDD125 pKa = 3.55TAQCPNCRR133 pKa = 11.84RR134 pKa = 11.84TFAPSEE140 pKa = 4.22VEE142 pKa = 4.18LEE144 pKa = 4.27EE145 pKa = 4.28EE146 pKa = 4.21
Molecular weight: 16.45 kDa
Isoelectric point according different methods:
Protein with the highest isoelectric point:
>tr|D2Z2P3|D2Z2P3_9BACT Deoxyuridine 5'-triphosphate nucleotidohydrolase OS=Dethiosulfovibrio peptidovorans DSM 11002 OX=469381 GN=dut PE=3 SV=1
MM1 pKa = 7.26KK2 pKa = 9.53QTFQPHH8 pKa = 4.48NRR10 pKa = 11.84PRR12 pKa = 11.84KK13 pKa = 8.83RR14 pKa = 11.84KK15 pKa = 8.04MGFLARR21 pKa = 11.84SSSPSGRR28 pKa = 11.84RR29 pKa = 11.84ILANRR34 pKa = 11.84RR35 pKa = 11.84AKK37 pKa = 9.82GRR39 pKa = 11.84KK40 pKa = 8.69RR41 pKa = 11.84LAVV44 pKa = 3.41
MM1 pKa = 7.26KK2 pKa = 9.53QTFQPHH8 pKa = 4.48NRR10 pKa = 11.84PRR12 pKa = 11.84KK13 pKa = 8.83RR14 pKa = 11.84KK15 pKa = 8.04MGFLARR21 pKa = 11.84SSSPSGRR28 pKa = 11.84RR29 pKa = 11.84ILANRR34 pKa = 11.84RR35 pKa = 11.84AKK37 pKa = 9.82GRR39 pKa = 11.84KK40 pKa = 8.69RR41 pKa = 11.84LAVV44 pKa = 3.41
Molecular weight: 5.15 kDa
Isoelectric point according different methods:
Peptides (in silico digests for buttom-up proteomics)
Below you can find in silico digests of the whole proteome with Trypsin, Chymotrypsin, Trypsin+LysC, LysN, ArgC proteases suitable for different mass spec machines.| Try ESI |
 |
|---|
| ChTry ESI |
 |
|---|
| ArgC ESI |
 |
|---|
| LysN ESI |
 |
|---|
| TryLysC ESI |
 |
|---|
| Try MALDI |
 |
|---|
| ChTry MALDI |
 |
|---|
| ArgC MALDI |
 |
|---|
| LysN MALDI |
 |
|---|
| TryLysC MALDI |
 |
|---|
| Try LTQ |
 |
|---|
| ChTry LTQ |
 |
|---|
| ArgC LTQ |
 |
|---|
| LysN LTQ |
 |
|---|
| TryLysC LTQ |
 |
|---|
| Try MSlow |
 |
|---|
| ChTry MSlow |
 |
|---|
| ArgC MSlow |
 |
|---|
| LysN MSlow |
 |
|---|
| TryLysC MSlow |
 |
|---|
| Try MShigh |
 |
|---|
| ChTry MShigh |
 |
|---|
| ArgC MShigh |
 |
|---|
| LysN MShigh |
 |
|---|
| TryLysC MShigh |
 |
|---|
General Statistics
Number of major isoforms |
Number of additional isoforms |
Number of all proteins |
Number of amino acids |
Min. Seq. Length |
Max. Seq. Length |
Avg. Seq. Length |
Avg. Mol. Weight |
|---|---|---|---|---|---|---|---|
0 |
782988 |
30 |
1943 |
322.0 |
35.44 |
Amino acid frequency
Ala |
Cys |
Asp |
Glu |
Phe |
Gly |
His |
Ile |
Lys |
Leu |
|---|---|---|---|---|---|---|---|---|---|
8.151 ± 0.05 | 1.206 ± 0.018 |
6.162 ± 0.041 | 6.971 ± 0.048 |
3.785 ± 0.031 | 8.71 ± 0.042 |
1.584 ± 0.017 | 5.824 ± 0.04 |
4.925 ± 0.039 | 10.169 ± 0.05 |
Met |
Asn |
Gln |
Pro |
Arg |
Ser |
Thr |
Val |
Trp |
Tyr |
|---|---|---|---|---|---|---|---|---|---|
3.097 ± 0.021 | 2.655 ± 0.029 |
4.399 ± 0.033 | 2.22 ± 0.023 |
6.442 ± 0.053 | 7.138 ± 0.048 |
4.518 ± 0.035 | 8.168 ± 0.041 |
1.286 ± 0.021 | 2.59 ± 0.025 |
Most of the basic statistics you can see at this page can be downloaded from this CSV file
Proteome-pI is available under Creative Commons Attribution-NoDerivs license, for more details see here
| Reference: Kozlowski LP. Proteome-pI 2.0: Proteome Isoelectric Point Database Update. Nucleic Acids Res. 2021, doi: 10.1093/nar/gkab944 | Contact: Lukasz P. Kozlowski |
