Rhizobacter gummiphilus
Taxonomy: cellular organisms; Bacteria; Proteobacteria; Betaproteobacteria; Burkholderiales; Burkholderiales genera incertae sedis; Rhizobacter
Average proteome isoelectric point is 6.82
Get precalculated fractions of proteins
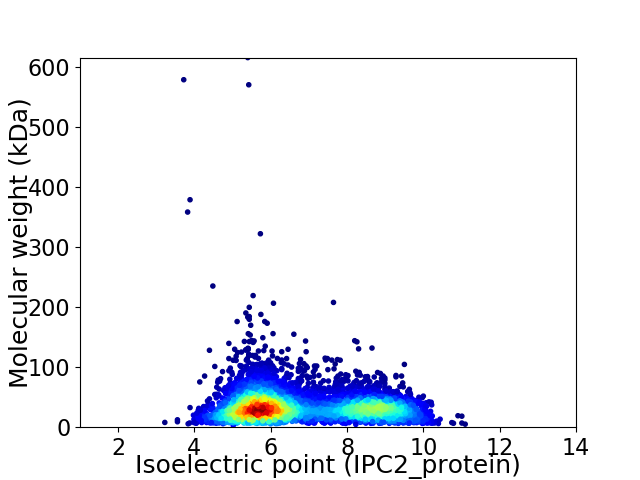
Virtual 2D-PAGE plot for 5678 proteins (isoelectric point calculated using IPC2_protein)
Get csv file with sequences according to given criteria:
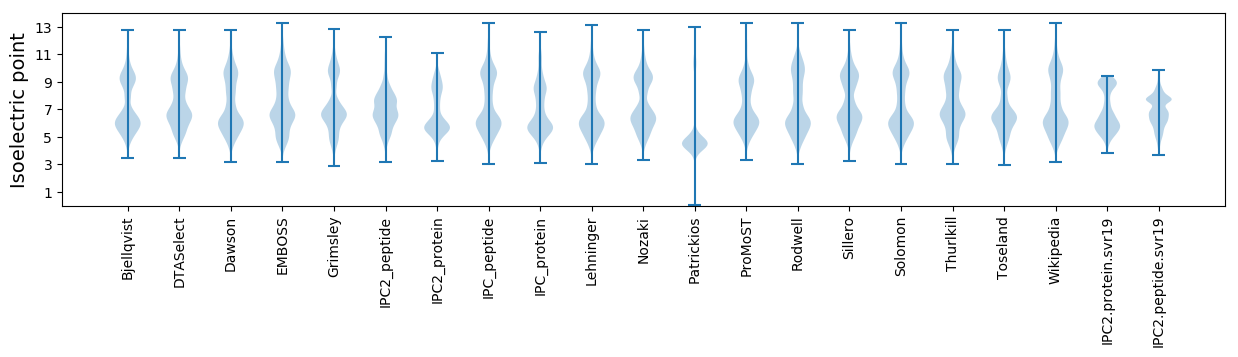
* You can choose from 21 different methods for calculating isoelectric point
Summary statistics related to proteome-wise predictions
Protein with the lowest isoelectric point:
>tr|A0A1W6LA27|A0A1W6LA27_9BURK ABC transporter substrate-binding protein OS=Rhizobacter gummiphilus OX=946333 GN=A4W93_15325 PE=4 SV=1
MM1 pKa = 6.89TTTALPDD8 pKa = 4.5PDD10 pKa = 4.5PMPVAPEE17 pKa = 4.22PPDD20 pKa = 5.0LDD22 pKa = 3.74EE23 pKa = 5.14CCGNGCDD30 pKa = 3.59PCIFDD35 pKa = 4.89LHH37 pKa = 6.93DD38 pKa = 4.08LAMDD42 pKa = 5.13AYY44 pKa = 10.33RR45 pKa = 11.84QDD47 pKa = 2.94LRR49 pKa = 11.84AWRR52 pKa = 11.84EE53 pKa = 3.72RR54 pKa = 11.84HH55 pKa = 5.95PEE57 pKa = 3.64ASAGGG62 pKa = 3.6
MM1 pKa = 6.89TTTALPDD8 pKa = 4.5PDD10 pKa = 4.5PMPVAPEE17 pKa = 4.22PPDD20 pKa = 5.0LDD22 pKa = 3.74EE23 pKa = 5.14CCGNGCDD30 pKa = 3.59PCIFDD35 pKa = 4.89LHH37 pKa = 6.93DD38 pKa = 4.08LAMDD42 pKa = 5.13AYY44 pKa = 10.33RR45 pKa = 11.84QDD47 pKa = 2.94LRR49 pKa = 11.84AWRR52 pKa = 11.84EE53 pKa = 3.72RR54 pKa = 11.84HH55 pKa = 5.95PEE57 pKa = 3.64ASAGGG62 pKa = 3.6
Molecular weight: 6.78 kDa
Isoelectric point according different methods:
Protein with the highest isoelectric point:
>tr|A0A1W6L2W4|A0A1W6L2W4_9BURK DUF4124 domain-containing protein OS=Rhizobacter gummiphilus OX=946333 GN=A4W93_01075 PE=4 SV=1
MM1 pKa = 7.96ALLQPQARR9 pKa = 11.84PLAHH13 pKa = 7.0PASTRR18 pKa = 11.84QPVMPTGVRR27 pKa = 11.84PMPPAPARR35 pKa = 11.84AFQVLQTHH43 pKa = 6.01RR44 pKa = 11.84TPTQLSLFAPPVAQRR59 pKa = 11.84NVTRR63 pKa = 4.5
MM1 pKa = 7.96ALLQPQARR9 pKa = 11.84PLAHH13 pKa = 7.0PASTRR18 pKa = 11.84QPVMPTGVRR27 pKa = 11.84PMPPAPARR35 pKa = 11.84AFQVLQTHH43 pKa = 6.01RR44 pKa = 11.84TPTQLSLFAPPVAQRR59 pKa = 11.84NVTRR63 pKa = 4.5
Molecular weight: 6.9 kDa
Isoelectric point according different methods:
Peptides (in silico digests for buttom-up proteomics)
Below you can find in silico digests of the whole proteome with Trypsin, Chymotrypsin, Trypsin+LysC, LysN, ArgC proteases suitable for different mass spec machines.| Try ESI |
 |
|---|
| ChTry ESI |
|
|---|
| ArgC ESI |
|
|---|
| LysN ESI |
|
|---|
| TryLysC ESI |
|
|---|
| Try MALDI |
|
|---|
| ChTry MALDI |
|
|---|
| ArgC MALDI |
|
|---|
| LysN MALDI |
|
|---|
| TryLysC MALDI |
|
|---|
| Try LTQ |
|
|---|
| ChTry LTQ |
|
|---|
| ArgC LTQ |
|
|---|
| LysN LTQ |
|
|---|
| TryLysC LTQ |
|
|---|
| Try MSlow |
|
|---|
| ChTry MSlow |
|
|---|
| ArgC MSlow |
|
|---|
| LysN MSlow |
|
|---|
| TryLysC MSlow |
|
|---|
| Try MShigh |
|
|---|
| ChTry MShigh |
|
|---|
| ArgC MShigh |
|
|---|
| LysN MShigh |
|
|---|
| TryLysC MShigh |
|
|---|
General Statistics
Number of major isoforms |
Number of additional isoforms |
Number of all proteins |
Number of amino acids |
Min. Seq. Length |
Max. Seq. Length |
Avg. Seq. Length |
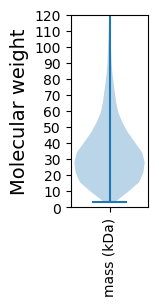
Avg. Mol. Weight |
|---|---|---|---|---|---|---|---|
0 |
1907566 |
30 |
5804 |
336.0 |
36.27 |
Amino acid frequency
Ala |
Cys |
Asp |
Glu |
Phe |
Gly |
His |
Ile |
Lys |
Leu |
|---|---|---|---|---|---|---|---|---|---|
13.16 ± 0.049 | 0.813 ± 0.012 |
5.577 ± 0.023 | 5.048 ± 0.033 |
3.511 ± 0.02 | 8.567 ± 0.033 |
2.277 ± 0.019 | 3.753 ± 0.022 |
2.888 ± 0.028 | 10.66 ± 0.047 |
Met |
Asn |
Gln |
Pro |
Arg |
Ser |
Thr |
Val |
Trp |
Tyr |
|---|---|---|---|---|---|---|---|---|---|
2.236 ± 0.016 | 2.426 ± 0.025 |
5.565 ± 0.03 | 3.461 ± 0.021 |
7.28 ± 0.041 | 5.281 ± 0.029 |
5.598 ± 0.053 | 8.342 ± 0.028 |
1.51 ± 0.016 | 2.047 ± 0.019 |
Most of the basic statistics you can see at this page can be downloaded from this CSV file
See this proteome in:

Proteome-pI is available under Creative Commons Attribution-NoDerivs license, for more details see here
| Reference: Kozlowski LP. Proteome-pI 2.0: Proteome Isoelectric Point Database Update. Nucleic Acids Res. 2021, doi: 10.1093/nar/gkab944 | Contact: Lukasz P. Kozlowski |