Ralstonia phage RSJ5
Taxonomy: Viruses; Duplodnaviria; Heunggongvirae; Uroviricota; Caudoviricetes; Caudovirales; Autographiviridae; Okabevirinae; Risjevirus; Ralstonia virus RSJ5
Average proteome isoelectric point is 6.55
Get precalculated fractions of proteins

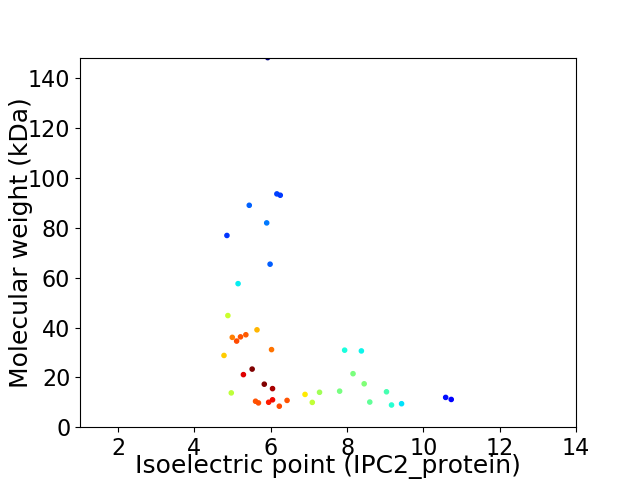
Virtual 2D-PAGE plot for 41 proteins (isoelectric point calculated using IPC2_protein)
Get csv file with sequences according to given criteria:
* You can choose from 21 different methods for calculating isoelectric point
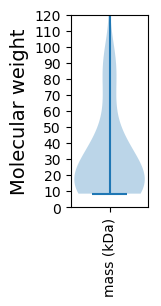
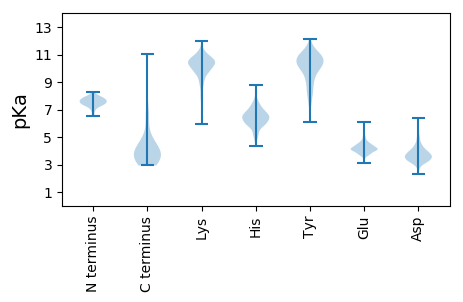
Summary statistics related to proteome-wise predictions


Protein with the lowest isoelectric point:
>tr|A0A077KVQ4|A0A077KVQ4_9CAUD Putative internal virion protein OS=Ralstonia phage RSJ5 OX=1538364 PE=4 SV=1
MM1 pKa = 6.51TTEE4 pKa = 4.01ATQAAAASADD14 pKa = 3.6QTAATAAATTATSGTPATQQSAAPATPAANPAAAQVKK51 pKa = 10.17DD52 pKa = 3.7LGIGTGEE59 pKa = 4.05NAAGPGKK66 pKa = 10.0AANGIEE72 pKa = 4.53YY73 pKa = 10.61YY74 pKa = 10.6SEE76 pKa = 3.65TGYY79 pKa = 11.46AGLDD83 pKa = 3.2AALKK87 pKa = 10.22FMVDD91 pKa = 2.95AGLNDD96 pKa = 3.79DD97 pKa = 4.58HH98 pKa = 6.99PAIKK102 pKa = 10.21AVEE105 pKa = 4.16KK106 pKa = 11.1NDD108 pKa = 3.49FSLLEE113 pKa = 4.66AYY115 pKa = 8.83FATNPVAGWEE125 pKa = 4.23TMLKK129 pKa = 9.67IGRR132 pKa = 11.84EE133 pKa = 4.01GFEE136 pKa = 4.63RR137 pKa = 11.84MLKK140 pKa = 10.58DD141 pKa = 3.43VGEE144 pKa = 4.43KK145 pKa = 10.33GAALEE150 pKa = 4.19RR151 pKa = 11.84TNKK154 pKa = 9.78EE155 pKa = 3.25MGVALFGDD163 pKa = 4.27EE164 pKa = 4.19ATLNAALDD172 pKa = 4.14YY173 pKa = 10.79FPTIPGIEE181 pKa = 4.06QADD184 pKa = 3.7VDD186 pKa = 4.54GVQAMIRR193 pKa = 11.84AGGVQAQAAMLLIQDD208 pKa = 4.25QFNAAQGVTRR218 pKa = 11.84APLEE222 pKa = 4.47DD223 pKa = 3.4VSQRR227 pKa = 11.84TATYY231 pKa = 10.19QSQGDD236 pKa = 4.21HH237 pKa = 6.64SPLSARR243 pKa = 11.84QFTEE247 pKa = 3.86EE248 pKa = 3.87CHH250 pKa = 6.05KK251 pKa = 10.64LRR253 pKa = 11.84RR254 pKa = 11.84ALGDD258 pKa = 3.49SFEE261 pKa = 4.15QTPQYY266 pKa = 10.12RR267 pKa = 11.84ALAARR272 pKa = 11.84VRR274 pKa = 11.84RR275 pKa = 3.95
MM1 pKa = 6.51TTEE4 pKa = 4.01ATQAAAASADD14 pKa = 3.6QTAATAAATTATSGTPATQQSAAPATPAANPAAAQVKK51 pKa = 10.17DD52 pKa = 3.7LGIGTGEE59 pKa = 4.05NAAGPGKK66 pKa = 10.0AANGIEE72 pKa = 4.53YY73 pKa = 10.61YY74 pKa = 10.6SEE76 pKa = 3.65TGYY79 pKa = 11.46AGLDD83 pKa = 3.2AALKK87 pKa = 10.22FMVDD91 pKa = 2.95AGLNDD96 pKa = 3.79DD97 pKa = 4.58HH98 pKa = 6.99PAIKK102 pKa = 10.21AVEE105 pKa = 4.16KK106 pKa = 11.1NDD108 pKa = 3.49FSLLEE113 pKa = 4.66AYY115 pKa = 8.83FATNPVAGWEE125 pKa = 4.23TMLKK129 pKa = 9.67IGRR132 pKa = 11.84EE133 pKa = 4.01GFEE136 pKa = 4.63RR137 pKa = 11.84MLKK140 pKa = 10.58DD141 pKa = 3.43VGEE144 pKa = 4.43KK145 pKa = 10.33GAALEE150 pKa = 4.19RR151 pKa = 11.84TNKK154 pKa = 9.78EE155 pKa = 3.25MGVALFGDD163 pKa = 4.27EE164 pKa = 4.19ATLNAALDD172 pKa = 4.14YY173 pKa = 10.79FPTIPGIEE181 pKa = 4.06QADD184 pKa = 3.7VDD186 pKa = 4.54GVQAMIRR193 pKa = 11.84AGGVQAQAAMLLIQDD208 pKa = 4.25QFNAAQGVTRR218 pKa = 11.84APLEE222 pKa = 4.47DD223 pKa = 3.4VSQRR227 pKa = 11.84TATYY231 pKa = 10.19QSQGDD236 pKa = 4.21HH237 pKa = 6.64SPLSARR243 pKa = 11.84QFTEE247 pKa = 3.86EE248 pKa = 3.87CHH250 pKa = 6.05KK251 pKa = 10.64LRR253 pKa = 11.84RR254 pKa = 11.84ALGDD258 pKa = 3.49SFEE261 pKa = 4.15QTPQYY266 pKa = 10.12RR267 pKa = 11.84ALAARR272 pKa = 11.84VRR274 pKa = 11.84RR275 pKa = 3.95
Molecular weight: 28.8 kDa
Isoelectric point according different methods:
Protein with the highest isoelectric point:
>tr|A0A077KYK0|A0A077KYK0_9CAUD DNA-directed RNA polymerase OS=Ralstonia phage RSJ5 OX=1538364 PE=3 SV=1
MM1 pKa = 7.3SRR3 pKa = 11.84TVSTRR8 pKa = 11.84LRR10 pKa = 11.84DD11 pKa = 4.13GKK13 pKa = 8.07WTSPTRR19 pKa = 11.84YY20 pKa = 8.91WITAIPTGEE29 pKa = 3.97FEE31 pKa = 4.14RR32 pKa = 11.84RR33 pKa = 11.84SVGGTMVFLAKK44 pKa = 10.29SRR46 pKa = 11.84TGRR49 pKa = 11.84TVWALTLPVAKK60 pKa = 9.51GWHH63 pKa = 6.65RR64 pKa = 11.84GRR66 pKa = 11.84ISATSRR72 pKa = 11.84TTLRR76 pKa = 11.84STPSLSTSTAIRR88 pKa = 11.84RR89 pKa = 11.84TRR91 pKa = 11.84LNARR95 pKa = 11.84RR96 pKa = 11.84WTT98 pKa = 3.58
MM1 pKa = 7.3SRR3 pKa = 11.84TVSTRR8 pKa = 11.84LRR10 pKa = 11.84DD11 pKa = 4.13GKK13 pKa = 8.07WTSPTRR19 pKa = 11.84YY20 pKa = 8.91WITAIPTGEE29 pKa = 3.97FEE31 pKa = 4.14RR32 pKa = 11.84RR33 pKa = 11.84SVGGTMVFLAKK44 pKa = 10.29SRR46 pKa = 11.84TGRR49 pKa = 11.84TVWALTLPVAKK60 pKa = 9.51GWHH63 pKa = 6.65RR64 pKa = 11.84GRR66 pKa = 11.84ISATSRR72 pKa = 11.84TTLRR76 pKa = 11.84STPSLSTSTAIRR88 pKa = 11.84RR89 pKa = 11.84TRR91 pKa = 11.84LNARR95 pKa = 11.84RR96 pKa = 11.84WTT98 pKa = 3.58
Molecular weight: 11.14 kDa
Isoelectric point according different methods:
Peptides (in silico digests for buttom-up proteomics)
Below you can find in silico digests of the whole proteome with Trypsin, Chymotrypsin, Trypsin+LysC, LysN, ArgC proteases suitable for different mass spec machines.| Try ESI |
 |
|---|
| ChTry ESI |
 |
|---|
| ArgC ESI |
 |
|---|
| LysN ESI |
 |
|---|
| TryLysC ESI |
 |
|---|
| Try MALDI |
 |
|---|
| ChTry MALDI |
 |
|---|
| ArgC MALDI |
 |
|---|
| LysN MALDI |
 |
|---|
| TryLysC MALDI |
 |
|---|
| Try LTQ |
 |
|---|
| ChTry LTQ |
 |
|---|
| ArgC LTQ |
 |
|---|
| LysN LTQ |
 |
|---|
| TryLysC LTQ |
 |
|---|
| Try MSlow |
 |
|---|
| ChTry MSlow |
 |
|---|
| ArgC MSlow |
 |
|---|
| LysN MSlow |
 |
|---|
| TryLysC MSlow |
 |
|---|
| Try MShigh |
 |
|---|
| ChTry MShigh |
 |
|---|
| ArgC MShigh |
 |
|---|
| LysN MShigh |
 |
|---|
| TryLysC MShigh |
 |
|---|
General Statistics
Number of major isoforms |
Number of additional isoforms |
Number of all proteins |
Number of amino acids |
Min. Seq. Length |
Max. Seq. Length |
Avg. Seq. Length |
Avg. Mol. Weight |
|---|---|---|---|---|---|---|---|
0 |
12386 |
75 |
1372 |
302.1 |
33.25 |
Amino acid frequency
Ala |
Cys |
Asp |
Glu |
Phe |
Gly |
His |
Ile |
Lys |
Leu |
|---|---|---|---|---|---|---|---|---|---|
11.739 ± 0.704 | 0.824 ± 0.164 |
6.273 ± 0.187 | 5.619 ± 0.368 |
3.359 ± 0.183 | 7.807 ± 0.333 |
1.962 ± 0.197 | 4.392 ± 0.222 |
5.256 ± 0.243 | 7.686 ± 0.379 |
Met |
Asn |
Gln |
Pro |
Arg |
Ser |
Thr |
Val |
Trp |
Tyr |
|---|---|---|---|---|---|---|---|---|---|
2.777 ± 0.205 | 4.287 ± 0.238 |
4.295 ± 0.24 | 4.449 ± 0.316 |
6.031 ± 0.272 | 5.765 ± 0.303 |
6.007 ± 0.409 | 6.556 ± 0.306 |
1.704 ± 0.178 | 3.213 ± 0.202 |
Most of the basic statistics you can see at this page can be downloaded from this CSV file
Proteome-pI is available under Creative Commons Attribution-NoDerivs license, for more details see here
| Reference: Kozlowski LP. Proteome-pI 2.0: Proteome Isoelectric Point Database Update. Nucleic Acids Res. 2021, doi: 10.1093/nar/gkab944 | Contact: Lukasz P. Kozlowski |
