Erythrobacter sp. EC-HK427
Taxonomy: cellular organisms; Bacteria; Proteobacteria; Alphaproteobacteria; Sphingomonadales; Erythrobacteraceae; Erythrobacter/Porphyrobacter group; Erythrobacter; unclassified Erythrobacter
Average proteome isoelectric point is 5.95
Get precalculated fractions of proteins

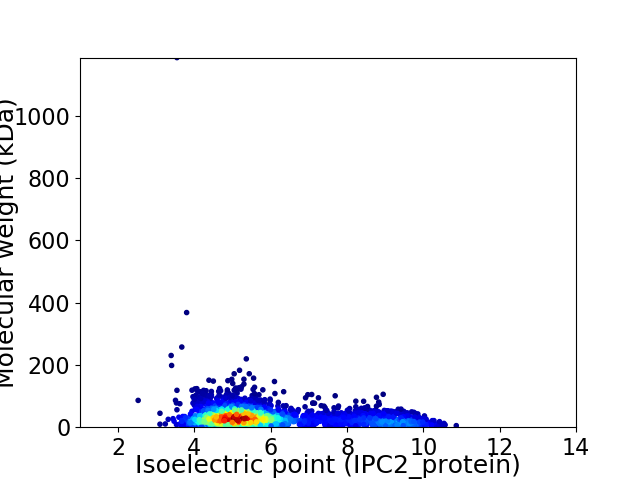
Virtual 2D-PAGE plot for 3085 proteins (isoelectric point calculated using IPC2_protein)
Get csv file with sequences according to given criteria:
* You can choose from 21 different methods for calculating isoelectric point
Summary statistics related to proteome-wise predictions


Protein with the lowest isoelectric point:
>tr|A0A5E7Y2H2|A0A5E7Y2H2_9SPHN NAD(P)H:quinone oxidoreductase OS=Erythrobacter sp. EC-HK427 OX=2038396 GN=ytfG PE=4 SV=1
MM1 pKa = 7.45ARR3 pKa = 11.84PRR5 pKa = 11.84NSLAWLLSDD14 pKa = 4.15SSRR17 pKa = 11.84LVPVAIALAAMAGPVAAQAQTATNTVNVNGPSGLTDD53 pKa = 3.6PVAANNSATDD63 pKa = 3.15SDD65 pKa = 4.66TIIVAPSAGPGTMSYY80 pKa = 8.92ATSGNGLHH88 pKa = 5.36QTSIAILDD96 pKa = 3.7WSTSSIVDD104 pKa = 4.57GIQNGDD110 pKa = 3.59VVNFALTGCRR120 pKa = 11.84TGTLTATFSNVVNAGAMDD138 pKa = 3.6IRR140 pKa = 11.84DD141 pKa = 3.54MEE143 pKa = 4.45TWVGSSAFQAYY154 pKa = 9.18NGPGAGEE161 pKa = 4.67AIHH164 pKa = 6.7TIVDD168 pKa = 3.74DD169 pKa = 5.44LGFTINWSLIVGGQAQPLDD188 pKa = 4.74LIFFDD193 pKa = 5.56AEE195 pKa = 4.08ATNVTNEE202 pKa = 4.55SITATTNGGGWALIEE217 pKa = 4.23NVGGTGYY224 pKa = 9.25TIAGVGSQTISITQTEE240 pKa = 4.95GPSNSPVLLTKK251 pKa = 10.33SASRR255 pKa = 11.84TDD257 pKa = 3.32VSIVAGGNQAVAFGVLLPCDD277 pKa = 4.0YY278 pKa = 11.42SDD280 pKa = 4.85APASYY285 pKa = 10.69GSAAHH290 pKa = 7.5AFRR293 pKa = 11.84EE294 pKa = 4.42DD295 pKa = 3.47AASSGLGLVADD306 pKa = 5.12ASQPILGTGIDD317 pKa = 4.38PEE319 pKa = 5.11FSAQPSVNADD329 pKa = 3.15GDD331 pKa = 4.02DD332 pKa = 3.75TDD334 pKa = 3.96TQGDD338 pKa = 4.08DD339 pKa = 3.61EE340 pKa = 5.46NGVSTFQTLTRR351 pKa = 11.84ATTTYY356 pKa = 9.69TLPAANFTVSGSGNLYY372 pKa = 10.19GWVDD376 pKa = 3.98FDD378 pKa = 5.41GNGTFDD384 pKa = 3.5TDD386 pKa = 3.3EE387 pKa = 4.42FASTTVTGGVPASDD401 pKa = 4.11LVWAGVSGVTSGASTYY417 pKa = 10.55VRR419 pKa = 11.84LRR421 pKa = 11.84FTADD425 pKa = 2.71TLTASGATATAGSGEE440 pKa = 4.2VEE442 pKa = 4.76DD443 pKa = 4.45YY444 pKa = 11.34LVTLTTAVDD453 pKa = 3.8LALTKK458 pKa = 10.67TNTPGVNGEE467 pKa = 3.9VDD469 pKa = 3.49QLDD472 pKa = 3.66DD473 pKa = 3.84TLISGSTTTYY483 pKa = 9.51TIRR486 pKa = 11.84VTNTGPDD493 pKa = 3.7DD494 pKa = 3.75AVGAILTDD502 pKa = 3.53TPGAGLTCDD511 pKa = 3.17AASPVTITGDD521 pKa = 3.64GVPAGSFTIADD532 pKa = 3.73LTGAGITLGTLSTGQTTTLSYY553 pKa = 10.87SCQVNN558 pKa = 3.11
MM1 pKa = 7.45ARR3 pKa = 11.84PRR5 pKa = 11.84NSLAWLLSDD14 pKa = 4.15SSRR17 pKa = 11.84LVPVAIALAAMAGPVAAQAQTATNTVNVNGPSGLTDD53 pKa = 3.6PVAANNSATDD63 pKa = 3.15SDD65 pKa = 4.66TIIVAPSAGPGTMSYY80 pKa = 8.92ATSGNGLHH88 pKa = 5.36QTSIAILDD96 pKa = 3.7WSTSSIVDD104 pKa = 4.57GIQNGDD110 pKa = 3.59VVNFALTGCRR120 pKa = 11.84TGTLTATFSNVVNAGAMDD138 pKa = 3.6IRR140 pKa = 11.84DD141 pKa = 3.54MEE143 pKa = 4.45TWVGSSAFQAYY154 pKa = 9.18NGPGAGEE161 pKa = 4.67AIHH164 pKa = 6.7TIVDD168 pKa = 3.74DD169 pKa = 5.44LGFTINWSLIVGGQAQPLDD188 pKa = 4.74LIFFDD193 pKa = 5.56AEE195 pKa = 4.08ATNVTNEE202 pKa = 4.55SITATTNGGGWALIEE217 pKa = 4.23NVGGTGYY224 pKa = 9.25TIAGVGSQTISITQTEE240 pKa = 4.95GPSNSPVLLTKK251 pKa = 10.33SASRR255 pKa = 11.84TDD257 pKa = 3.32VSIVAGGNQAVAFGVLLPCDD277 pKa = 4.0YY278 pKa = 11.42SDD280 pKa = 4.85APASYY285 pKa = 10.69GSAAHH290 pKa = 7.5AFRR293 pKa = 11.84EE294 pKa = 4.42DD295 pKa = 3.47AASSGLGLVADD306 pKa = 5.12ASQPILGTGIDD317 pKa = 4.38PEE319 pKa = 5.11FSAQPSVNADD329 pKa = 3.15GDD331 pKa = 4.02DD332 pKa = 3.75TDD334 pKa = 3.96TQGDD338 pKa = 4.08DD339 pKa = 3.61EE340 pKa = 5.46NGVSTFQTLTRR351 pKa = 11.84ATTTYY356 pKa = 9.69TLPAANFTVSGSGNLYY372 pKa = 10.19GWVDD376 pKa = 3.98FDD378 pKa = 5.41GNGTFDD384 pKa = 3.5TDD386 pKa = 3.3EE387 pKa = 4.42FASTTVTGGVPASDD401 pKa = 4.11LVWAGVSGVTSGASTYY417 pKa = 10.55VRR419 pKa = 11.84LRR421 pKa = 11.84FTADD425 pKa = 2.71TLTASGATATAGSGEE440 pKa = 4.2VEE442 pKa = 4.76DD443 pKa = 4.45YY444 pKa = 11.34LVTLTTAVDD453 pKa = 3.8LALTKK458 pKa = 10.67TNTPGVNGEE467 pKa = 3.9VDD469 pKa = 3.49QLDD472 pKa = 3.66DD473 pKa = 3.84TLISGSTTTYY483 pKa = 9.51TIRR486 pKa = 11.84VTNTGPDD493 pKa = 3.7DD494 pKa = 3.75AVGAILTDD502 pKa = 3.53TPGAGLTCDD511 pKa = 3.17AASPVTITGDD521 pKa = 3.64GVPAGSFTIADD532 pKa = 3.73LTGAGITLGTLSTGQTTTLSYY553 pKa = 10.87SCQVNN558 pKa = 3.11
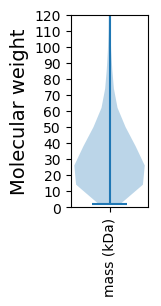
Molecular weight: 56.09 kDa
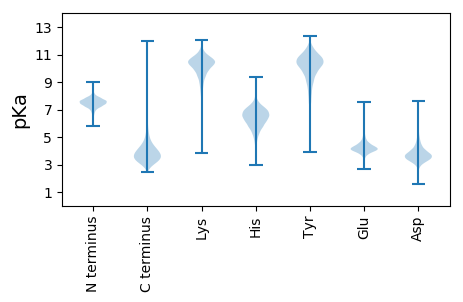
Isoelectric point according different methods:
Protein with the highest isoelectric point:
>tr|A0A5E7YPB7|A0A5E7YPB7_9SPHN Membrane protein SmpA OS=Erythrobacter sp. EC-HK427 OX=2038396 GN=ERY430_41445 PE=4 SV=1
MM1 pKa = 7.55KK2 pKa = 10.23RR3 pKa = 11.84FKK5 pKa = 10.48VQLMSDD11 pKa = 3.91CTDD14 pKa = 3.45EE15 pKa = 5.14LPARR19 pKa = 11.84CRR21 pKa = 11.84WSIVTASNFNQCVWLMRR38 pKa = 11.84LPLNQTVPVYY48 pKa = 9.57QRR50 pKa = 11.84KK51 pKa = 9.61RR52 pKa = 11.84NEE54 pKa = 4.35LLNQANSVRR63 pKa = 11.84NNRR66 pKa = 11.84PIAIFHH72 pKa = 6.47
MM1 pKa = 7.55KK2 pKa = 10.23RR3 pKa = 11.84FKK5 pKa = 10.48VQLMSDD11 pKa = 3.91CTDD14 pKa = 3.45EE15 pKa = 5.14LPARR19 pKa = 11.84CRR21 pKa = 11.84WSIVTASNFNQCVWLMRR38 pKa = 11.84LPLNQTVPVYY48 pKa = 9.57QRR50 pKa = 11.84KK51 pKa = 9.61RR52 pKa = 11.84NEE54 pKa = 4.35LLNQANSVRR63 pKa = 11.84NNRR66 pKa = 11.84PIAIFHH72 pKa = 6.47
Molecular weight: 8.56 kDa
Isoelectric point according different methods:
Peptides (in silico digests for buttom-up proteomics)
Below you can find in silico digests of the whole proteome with Trypsin, Chymotrypsin, Trypsin+LysC, LysN, ArgC proteases suitable for different mass spec machines.| Try ESI |
 |
|---|
| ChTry ESI |
 |
|---|
| ArgC ESI |
 |
|---|
| LysN ESI |
 |
|---|
| TryLysC ESI |
 |
|---|
| Try MALDI |
 |
|---|
| ChTry MALDI |
 |
|---|
| ArgC MALDI |
 |
|---|
| LysN MALDI |
 |
|---|
| TryLysC MALDI |
 |
|---|
| Try LTQ |
 |
|---|
| ChTry LTQ |
 |
|---|
| ArgC LTQ |
 |
|---|
| LysN LTQ |
 |
|---|
| TryLysC LTQ |
 |
|---|
| Try MSlow |
 |
|---|
| ChTry MSlow |
 |
|---|
| ArgC MSlow |
 |
|---|
| LysN MSlow |
 |
|---|
| TryLysC MSlow |
 |
|---|
| Try MShigh |
 |
|---|
| ChTry MShigh |
 |
|---|
| ArgC MShigh |
 |
|---|
| LysN MShigh |
 |
|---|
| TryLysC MShigh |
 |
|---|
General Statistics
Number of major isoforms |
Number of additional isoforms |
Number of all proteins |
Number of amino acids |
Min. Seq. Length |
Max. Seq. Length |
Avg. Seq. Length |
Avg. Mol. Weight |
|---|---|---|---|---|---|---|---|
0 |
970700 |
20 |
11255 |
314.7 |
34.02 |
Amino acid frequency
Ala |
Cys |
Asp |
Glu |
Phe |
Gly |
His |
Ile |
Lys |
Leu |
|---|---|---|---|---|---|---|---|---|---|
13.034 ± 0.084 | 0.837 ± 0.017 |
6.117 ± 0.088 | 6.25 ± 0.044 |
3.78 ± 0.032 | 8.942 ± 0.058 |
1.92 ± 0.026 | 5.038 ± 0.033 |
2.674 ± 0.049 | 9.766 ± 0.056 |
Met |
Asn |
Gln |
Pro |
Arg |
Ser |
Thr |
Val |
Trp |
Tyr |
|---|---|---|---|---|---|---|---|---|---|
2.472 ± 0.028 | 2.727 ± 0.037 |
5.158 ± 0.04 | 3.266 ± 0.024 |
6.829 ± 0.048 | 5.306 ± 0.038 |
5.304 ± 0.045 | 6.936 ± 0.033 |
1.438 ± 0.02 | 2.206 ± 0.022 |
Most of the basic statistics you can see at this page can be downloaded from this CSV file
Proteome-pI is available under Creative Commons Attribution-NoDerivs license, for more details see here
| Reference: Kozlowski LP. Proteome-pI 2.0: Proteome Isoelectric Point Database Update. Nucleic Acids Res. 2021, doi: 10.1093/nar/gkab944 | Contact: Lukasz P. Kozlowski |
