Lachnospiraceae bacterium OM04-12BH
Taxonomy: cellular organisms; Bacteria; Terrabacteria group; Firmicutes; Clostridia; Eubacteriales; Lachnospiraceae; unclassified Lachnospiraceae
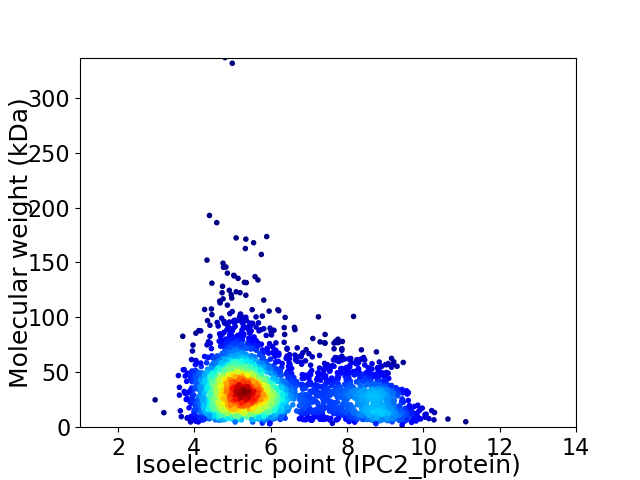
Average proteome isoelectric point is 6.04
Get precalculated fractions of proteins

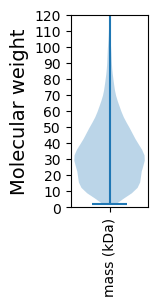
Virtual 2D-PAGE plot for 3107 proteins (isoelectric point calculated using IPC2_protein)
Get csv file with sequences according to given criteria:
* You can choose from 21 different methods for calculating isoelectric point
Summary statistics related to proteome-wise predictions


Protein with the lowest isoelectric point:
>tr|A0A417UA16|A0A417UA16_9FIRM Cupin domain-containing protein OS=Lachnospiraceae bacterium OM04-12BH OX=2292272 GN=DXB46_05585 PE=4 SV=1
MM1 pKa = 7.26KK2 pKa = 10.49KK3 pKa = 9.78KK4 pKa = 7.97WTTGKK9 pKa = 10.35IIGVSMLLVLGVVILWIAFVASVYY33 pKa = 10.63QLATVIEE40 pKa = 4.98GIEE43 pKa = 4.28RR44 pKa = 11.84ITAGRR49 pKa = 11.84AGITGDD55 pKa = 3.66SDD57 pKa = 5.49DD58 pKa = 3.82MDD60 pKa = 5.71GYY62 pKa = 11.12DD63 pKa = 5.81IEE65 pKa = 6.0DD66 pKa = 4.07FLNGDD71 pKa = 3.7SDD73 pKa = 3.77EE74 pKa = 4.52EE75 pKa = 4.88YY76 pKa = 11.39YY77 pKa = 11.1DD78 pKa = 3.83FEE80 pKa = 4.71QDD82 pKa = 3.3IRR84 pKa = 11.84DD85 pKa = 3.9DD86 pKa = 3.51LSYY89 pKa = 10.85EE90 pKa = 4.12VEE92 pKa = 4.05LEE94 pKa = 4.09EE95 pKa = 5.47FDD97 pKa = 5.64KK98 pKa = 11.29EE99 pKa = 5.75DD100 pKa = 3.68YY101 pKa = 10.55DD102 pKa = 4.53CPEE105 pKa = 3.88GTEE108 pKa = 3.75ARR110 pKa = 11.84LAITYY115 pKa = 8.21PVVTGDD121 pKa = 3.31IPNVEE126 pKa = 4.25EE127 pKa = 4.4INRR130 pKa = 11.84KK131 pKa = 9.64LYY133 pKa = 11.02EE134 pKa = 4.2EE135 pKa = 4.11VTAADD140 pKa = 4.15EE141 pKa = 4.68YY142 pKa = 9.64ITAVADD148 pKa = 3.77LMEE151 pKa = 6.21DD152 pKa = 3.61GDD154 pKa = 4.14SFEE157 pKa = 4.63YY158 pKa = 10.6QSEE161 pKa = 4.87CYY163 pKa = 7.67VTYY166 pKa = 9.76MDD168 pKa = 5.0EE169 pKa = 5.79DD170 pKa = 3.73ILSVAFQEE178 pKa = 4.8RR179 pKa = 11.84GILNDD184 pKa = 3.45SMIGAVIVSMNFDD197 pKa = 4.04LQTGLPVGNTGILDD211 pKa = 3.64IDD213 pKa = 4.24DD214 pKa = 4.1EE215 pKa = 4.45FAIDD219 pKa = 3.55FRR221 pKa = 11.84KK222 pKa = 10.21RR223 pKa = 11.84CEE225 pKa = 4.03EE226 pKa = 3.72QNGEE230 pKa = 4.23INGLNYY236 pKa = 10.68YY237 pKa = 10.31SDD239 pKa = 3.61QQIRR243 pKa = 11.84EE244 pKa = 4.09YY245 pKa = 9.95LTNEE249 pKa = 3.15NSLIIFYY256 pKa = 9.48TPLGMEE262 pKa = 3.78VGINYY267 pKa = 9.81DD268 pKa = 4.09DD269 pKa = 3.81GWATVTYY276 pKa = 10.56KK277 pKa = 10.73DD278 pKa = 3.63YY279 pKa = 11.77EE280 pKa = 4.31KK281 pKa = 10.32FTKK284 pKa = 10.27QFF286 pKa = 3.23
MM1 pKa = 7.26KK2 pKa = 10.49KK3 pKa = 9.78KK4 pKa = 7.97WTTGKK9 pKa = 10.35IIGVSMLLVLGVVILWIAFVASVYY33 pKa = 10.63QLATVIEE40 pKa = 4.98GIEE43 pKa = 4.28RR44 pKa = 11.84ITAGRR49 pKa = 11.84AGITGDD55 pKa = 3.66SDD57 pKa = 5.49DD58 pKa = 3.82MDD60 pKa = 5.71GYY62 pKa = 11.12DD63 pKa = 5.81IEE65 pKa = 6.0DD66 pKa = 4.07FLNGDD71 pKa = 3.7SDD73 pKa = 3.77EE74 pKa = 4.52EE75 pKa = 4.88YY76 pKa = 11.39YY77 pKa = 11.1DD78 pKa = 3.83FEE80 pKa = 4.71QDD82 pKa = 3.3IRR84 pKa = 11.84DD85 pKa = 3.9DD86 pKa = 3.51LSYY89 pKa = 10.85EE90 pKa = 4.12VEE92 pKa = 4.05LEE94 pKa = 4.09EE95 pKa = 5.47FDD97 pKa = 5.64KK98 pKa = 11.29EE99 pKa = 5.75DD100 pKa = 3.68YY101 pKa = 10.55DD102 pKa = 4.53CPEE105 pKa = 3.88GTEE108 pKa = 3.75ARR110 pKa = 11.84LAITYY115 pKa = 8.21PVVTGDD121 pKa = 3.31IPNVEE126 pKa = 4.25EE127 pKa = 4.4INRR130 pKa = 11.84KK131 pKa = 9.64LYY133 pKa = 11.02EE134 pKa = 4.2EE135 pKa = 4.11VTAADD140 pKa = 4.15EE141 pKa = 4.68YY142 pKa = 9.64ITAVADD148 pKa = 3.77LMEE151 pKa = 6.21DD152 pKa = 3.61GDD154 pKa = 4.14SFEE157 pKa = 4.63YY158 pKa = 10.6QSEE161 pKa = 4.87CYY163 pKa = 7.67VTYY166 pKa = 9.76MDD168 pKa = 5.0EE169 pKa = 5.79DD170 pKa = 3.73ILSVAFQEE178 pKa = 4.8RR179 pKa = 11.84GILNDD184 pKa = 3.45SMIGAVIVSMNFDD197 pKa = 4.04LQTGLPVGNTGILDD211 pKa = 3.64IDD213 pKa = 4.24DD214 pKa = 4.1EE215 pKa = 4.45FAIDD219 pKa = 3.55FRR221 pKa = 11.84KK222 pKa = 10.21RR223 pKa = 11.84CEE225 pKa = 4.03EE226 pKa = 3.72QNGEE230 pKa = 4.23INGLNYY236 pKa = 10.68YY237 pKa = 10.31SDD239 pKa = 3.61QQIRR243 pKa = 11.84EE244 pKa = 4.09YY245 pKa = 9.95LTNEE249 pKa = 3.15NSLIIFYY256 pKa = 9.48TPLGMEE262 pKa = 3.78VGINYY267 pKa = 9.81DD268 pKa = 4.09DD269 pKa = 3.81GWATVTYY276 pKa = 10.56KK277 pKa = 10.73DD278 pKa = 3.63YY279 pKa = 11.77EE280 pKa = 4.31KK281 pKa = 10.32FTKK284 pKa = 10.27QFF286 pKa = 3.23
Molecular weight: 32.56 kDa
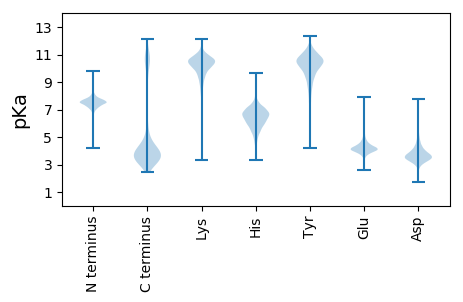
Isoelectric point according different methods:
Protein with the highest isoelectric point:
>tr|A0A417U6I5|A0A417U6I5_9FIRM ABC transporter permease OS=Lachnospiraceae bacterium OM04-12BH OX=2292272 GN=DXB46_07875 PE=4 SV=1
MM1 pKa = 7.67KK2 pKa = 8.71MTFQPKK8 pKa = 7.78TRR10 pKa = 11.84QRR12 pKa = 11.84SKK14 pKa = 8.97VHH16 pKa = 5.92GFRR19 pKa = 11.84ARR21 pKa = 11.84MSTPGGRR28 pKa = 11.84KK29 pKa = 8.8VLAARR34 pKa = 11.84RR35 pKa = 11.84AKK37 pKa = 9.71GRR39 pKa = 11.84KK40 pKa = 8.73VLSAA44 pKa = 4.05
MM1 pKa = 7.67KK2 pKa = 8.71MTFQPKK8 pKa = 7.78TRR10 pKa = 11.84QRR12 pKa = 11.84SKK14 pKa = 8.97VHH16 pKa = 5.92GFRR19 pKa = 11.84ARR21 pKa = 11.84MSTPGGRR28 pKa = 11.84KK29 pKa = 8.8VLAARR34 pKa = 11.84RR35 pKa = 11.84AKK37 pKa = 9.71GRR39 pKa = 11.84KK40 pKa = 8.73VLSAA44 pKa = 4.05
Molecular weight: 4.98 kDa
Isoelectric point according different methods:
Peptides (in silico digests for buttom-up proteomics)
Below you can find in silico digests of the whole proteome with Trypsin, Chymotrypsin, Trypsin+LysC, LysN, ArgC proteases suitable for different mass spec machines.| Try ESI |
 |
|---|
| ChTry ESI |
 |
|---|
| ArgC ESI |
 |
|---|
| LysN ESI |
 |
|---|
| TryLysC ESI |
 |
|---|
| Try MALDI |
 |
|---|
| ChTry MALDI |
 |
|---|
| ArgC MALDI |
 |
|---|
| LysN MALDI |
 |
|---|
| TryLysC MALDI |
 |
|---|
| Try LTQ |
 |
|---|
| ChTry LTQ |
 |
|---|
| ArgC LTQ |
 |
|---|
| LysN LTQ |
 |
|---|
| TryLysC LTQ |
 |
|---|
| Try MSlow |
 |
|---|
| ChTry MSlow |
 |
|---|
| ArgC MSlow |
 |
|---|
| LysN MSlow |
 |
|---|
| TryLysC MSlow |
 |
|---|
| Try MShigh |
 |
|---|
| ChTry MShigh |
 |
|---|
| ArgC MShigh |
 |
|---|
| LysN MShigh |
 |
|---|
| TryLysC MShigh |
 |
|---|
General Statistics
Number of major isoforms |
Number of additional isoforms |
Number of all proteins |
Number of amino acids |
Min. Seq. Length |
Max. Seq. Length |
Avg. Seq. Length |
Avg. Mol. Weight |
|---|---|---|---|---|---|---|---|
0 |
999537 |
16 |
2994 |
321.7 |
36.14 |
Amino acid frequency
Ala |
Cys |
Asp |
Glu |
Phe |
Gly |
His |
Ile |
Lys |
Leu |
|---|---|---|---|---|---|---|---|---|---|
7.592 ± 0.046 | 1.508 ± 0.017 |
5.516 ± 0.034 | 7.943 ± 0.047 |
4.147 ± 0.033 | 7.075 ± 0.04 |
1.686 ± 0.019 | 7.3 ± 0.039 |
6.589 ± 0.041 | 9.228 ± 0.052 |
Met |
Asn |
Gln |
Pro |
Arg |
Ser |
Thr |
Val |
Trp |
Tyr |
|---|---|---|---|---|---|---|---|---|---|
3.157 ± 0.023 | 4.1 ± 0.033 |
3.244 ± 0.022 | 3.306 ± 0.025 |
4.651 ± 0.042 | 5.77 ± 0.035 |
5.346 ± 0.033 | 6.725 ± 0.039 |
0.882 ± 0.014 | 4.234 ± 0.031 |
Most of the basic statistics you can see at this page can be downloaded from this CSV file
Proteome-pI is available under Creative Commons Attribution-NoDerivs license, for more details see here
| Reference: Kozlowski LP. Proteome-pI 2.0: Proteome Isoelectric Point Database Update. Nucleic Acids Res. 2021, doi: 10.1093/nar/gkab944 | Contact: Lukasz P. Kozlowski |
