Providencia phage vB_PreS-PibeRecoleta
Taxonomy: Viruses; Duplodnaviria; Heunggongvirae; Uroviricota; Caudoviricetes; Caudovirales; Siphoviridae; unclassified Siphoviridae
Average proteome isoelectric point is 6.22
Get precalculated fractions of proteins

Virtual 2D-PAGE plot for 73 proteins (isoelectric point calculated using IPC2_protein)
Get csv file with sequences according to given criteria:
* You can choose from 21 different methods for calculating isoelectric point
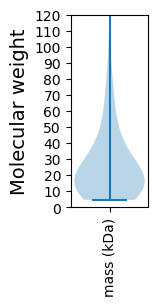
Summary statistics related to proteome-wise predictions


Protein with the lowest isoelectric point:
>tr|A0A7G5B0Z7|A0A7G5B0Z7_9CAUD Uncharacterized protein OS=Providencia phage vB_PreS-PibeRecoleta OX=2761109 PE=4 SV=1
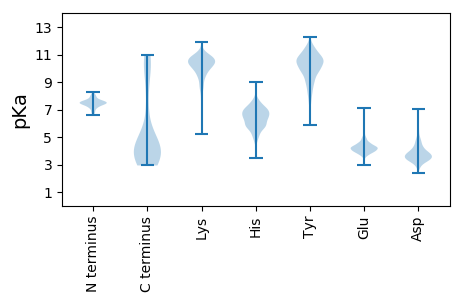
MM1 pKa = 7.57EE2 pKa = 5.05NLVTIASLFKK12 pKa = 10.4QWEE15 pKa = 4.28ADD17 pKa = 3.88VKK19 pKa = 8.84PHH21 pKa = 5.37VYY23 pKa = 10.9EE24 pKa = 4.36MFGEE28 pKa = 4.48CQDD31 pKa = 3.98SYY33 pKa = 11.26IEE35 pKa = 3.98SWMEE39 pKa = 4.25FLDD42 pKa = 4.72LPLARR47 pKa = 11.84DD48 pKa = 4.54QITQLQWAFAEE59 pKa = 4.15NFIEE63 pKa = 4.48ASHH66 pKa = 6.44YY67 pKa = 9.88ADD69 pKa = 2.95NWAEE73 pKa = 3.99EE74 pKa = 4.24FSRR77 pKa = 11.84LLTLLGVEE85 pKa = 4.5LKK87 pKa = 10.64SYY89 pKa = 9.94EE90 pKa = 4.3CSDD93 pKa = 3.08VDD95 pKa = 4.16IFGTANYY102 pKa = 10.09QYY104 pKa = 11.08VLEE107 pKa = 4.28RR108 pKa = 11.84HH109 pKa = 5.93GKK111 pKa = 6.31TLNGVYY117 pKa = 10.67SMPAKK122 pKa = 10.43NGEE125 pKa = 3.99PSRR128 pKa = 11.84DD129 pKa = 3.97DD130 pKa = 3.34ILEE133 pKa = 4.13CLFLEE138 pKa = 4.22YY139 pKa = 10.91SEE141 pKa = 6.26FEE143 pKa = 3.89EE144 pKa = 4.54CQNDD148 pKa = 3.17FRR150 pKa = 11.84YY151 pKa = 10.57YY152 pKa = 9.88CEE154 pKa = 5.16KK155 pKa = 10.74YY156 pKa = 10.45QLDD159 pKa = 3.9EE160 pKa = 4.72NEE162 pKa = 4.76AEE164 pKa = 4.51SKK166 pKa = 10.73SLYY169 pKa = 10.16DD170 pKa = 3.3QSEE173 pKa = 4.24KK174 pKa = 10.84LFQEE178 pKa = 4.46LPDD181 pKa = 4.14LFAHH185 pKa = 5.75NTTLTRR191 pKa = 11.84DD192 pKa = 3.75EE193 pKa = 4.47IVSGFADD200 pKa = 3.66IVWKK204 pKa = 10.4II205 pKa = 3.37
MM1 pKa = 7.57EE2 pKa = 5.05NLVTIASLFKK12 pKa = 10.4QWEE15 pKa = 4.28ADD17 pKa = 3.88VKK19 pKa = 8.84PHH21 pKa = 5.37VYY23 pKa = 10.9EE24 pKa = 4.36MFGEE28 pKa = 4.48CQDD31 pKa = 3.98SYY33 pKa = 11.26IEE35 pKa = 3.98SWMEE39 pKa = 4.25FLDD42 pKa = 4.72LPLARR47 pKa = 11.84DD48 pKa = 4.54QITQLQWAFAEE59 pKa = 4.15NFIEE63 pKa = 4.48ASHH66 pKa = 6.44YY67 pKa = 9.88ADD69 pKa = 2.95NWAEE73 pKa = 3.99EE74 pKa = 4.24FSRR77 pKa = 11.84LLTLLGVEE85 pKa = 4.5LKK87 pKa = 10.64SYY89 pKa = 9.94EE90 pKa = 4.3CSDD93 pKa = 3.08VDD95 pKa = 4.16IFGTANYY102 pKa = 10.09QYY104 pKa = 11.08VLEE107 pKa = 4.28RR108 pKa = 11.84HH109 pKa = 5.93GKK111 pKa = 6.31TLNGVYY117 pKa = 10.67SMPAKK122 pKa = 10.43NGEE125 pKa = 3.99PSRR128 pKa = 11.84DD129 pKa = 3.97DD130 pKa = 3.34ILEE133 pKa = 4.13CLFLEE138 pKa = 4.22YY139 pKa = 10.91SEE141 pKa = 6.26FEE143 pKa = 3.89EE144 pKa = 4.54CQNDD148 pKa = 3.17FRR150 pKa = 11.84YY151 pKa = 10.57YY152 pKa = 9.88CEE154 pKa = 5.16KK155 pKa = 10.74YY156 pKa = 10.45QLDD159 pKa = 3.9EE160 pKa = 4.72NEE162 pKa = 4.76AEE164 pKa = 4.51SKK166 pKa = 10.73SLYY169 pKa = 10.16DD170 pKa = 3.3QSEE173 pKa = 4.24KK174 pKa = 10.84LFQEE178 pKa = 4.46LPDD181 pKa = 4.14LFAHH185 pKa = 5.75NTTLTRR191 pKa = 11.84DD192 pKa = 3.75EE193 pKa = 4.47IVSGFADD200 pKa = 3.66IVWKK204 pKa = 10.4II205 pKa = 3.37
Molecular weight: 24.13 kDa
Isoelectric point according different methods:
Protein with the highest isoelectric point:
>tr|A0A7G5B105|A0A7G5B105_9CAUD Uncharacterized protein OS=Providencia phage vB_PreS-PibeRecoleta OX=2761109 PE=4 SV=1
MM1 pKa = 7.47KK2 pKa = 10.34SIPAYY7 pKa = 9.79YY8 pKa = 9.93IKK10 pKa = 10.66ALEE13 pKa = 4.23LAAEE17 pKa = 4.26SAGARR22 pKa = 11.84VGAFSRR28 pKa = 11.84LPDD31 pKa = 3.13INTPHH36 pKa = 7.19GYY38 pKa = 11.01LMRR41 pKa = 11.84SRR43 pKa = 11.84VAARR47 pKa = 11.84PNGGFWFTWFCNRR60 pKa = 11.84EE61 pKa = 4.02DD62 pKa = 3.7ASFAGMGGITAEE74 pKa = 4.3TLDD77 pKa = 3.51ILKK80 pKa = 8.99TRR82 pKa = 11.84IRR84 pKa = 11.84GAYY87 pKa = 8.48NRR89 pKa = 11.84QHH91 pKa = 7.04KK92 pKa = 10.61GGTSNRR98 pKa = 11.84AIEE101 pKa = 4.36LLRR104 pKa = 11.84KK105 pKa = 9.43RR106 pKa = 11.84ARR108 pKa = 11.84GG109 pKa = 3.38
MM1 pKa = 7.47KK2 pKa = 10.34SIPAYY7 pKa = 9.79YY8 pKa = 9.93IKK10 pKa = 10.66ALEE13 pKa = 4.23LAAEE17 pKa = 4.26SAGARR22 pKa = 11.84VGAFSRR28 pKa = 11.84LPDD31 pKa = 3.13INTPHH36 pKa = 7.19GYY38 pKa = 11.01LMRR41 pKa = 11.84SRR43 pKa = 11.84VAARR47 pKa = 11.84PNGGFWFTWFCNRR60 pKa = 11.84EE61 pKa = 4.02DD62 pKa = 3.7ASFAGMGGITAEE74 pKa = 4.3TLDD77 pKa = 3.51ILKK80 pKa = 8.99TRR82 pKa = 11.84IRR84 pKa = 11.84GAYY87 pKa = 8.48NRR89 pKa = 11.84QHH91 pKa = 7.04KK92 pKa = 10.61GGTSNRR98 pKa = 11.84AIEE101 pKa = 4.36LLRR104 pKa = 11.84KK105 pKa = 9.43RR106 pKa = 11.84ARR108 pKa = 11.84GG109 pKa = 3.38
Molecular weight: 12.07 kDa
Isoelectric point according different methods:
Peptides (in silico digests for buttom-up proteomics)
Below you can find in silico digests of the whole proteome with Trypsin, Chymotrypsin, Trypsin+LysC, LysN, ArgC proteases suitable for different mass spec machines.| Try ESI |
 |
|---|
| ChTry ESI |
 |
|---|
| ArgC ESI |
 |
|---|
| LysN ESI |
 |
|---|
| TryLysC ESI |
 |
|---|
| Try MALDI |
 |
|---|
| ChTry MALDI |
 |
|---|
| ArgC MALDI |
 |
|---|
| LysN MALDI |
 |
|---|
| TryLysC MALDI |
 |
|---|
| Try LTQ |
 |
|---|
| ChTry LTQ |
 |
|---|
| ArgC LTQ |
 |
|---|
| LysN LTQ |
 |
|---|
| TryLysC LTQ |
 |
|---|
| Try MSlow |
 |
|---|
| ChTry MSlow |
 |
|---|
| ArgC MSlow |
 |
|---|
| LysN MSlow |
 |
|---|
| TryLysC MSlow |
 |
|---|
| Try MShigh |
 |
|---|
| ChTry MShigh |
 |
|---|
| ArgC MShigh |
 |
|---|
| LysN MShigh |
 |
|---|
| TryLysC MShigh |
 |
|---|
General Statistics
Number of major isoforms |
Number of additional isoforms |
Number of all proteins |
Number of amino acids |
Min. Seq. Length |
Max. Seq. Length |
Avg. Seq. Length |
Avg. Mol. Weight |
|---|---|---|---|---|---|---|---|
0 |
18953 |
41 |
1438 |
259.6 |
28.99 |
Amino acid frequency
Ala |
Cys |
Asp |
Glu |
Phe |
Gly |
His |
Ile |
Lys |
Leu |
|---|---|---|---|---|---|---|---|---|---|
9.218 ± 0.565 | 0.944 ± 0.135 |
6.442 ± 0.286 | 6.659 ± 0.27 |
3.709 ± 0.172 | 6.996 ± 0.321 |
1.815 ± 0.171 | 5.614 ± 0.147 |
5.719 ± 0.357 | 7.471 ± 0.253 |
Met |
Asn |
Gln |
Pro |
Arg |
Ser |
Thr |
Val |
Trp |
Tyr |
|---|---|---|---|---|---|---|---|---|---|
3.139 ± 0.117 | 4.295 ± 0.187 |
4.501 ± 0.411 | 3.794 ± 0.365 |
5.503 ± 0.169 | 5.82 ± 0.182 |
6.205 ± 0.251 | 6.917 ± 0.268 |
1.683 ± 0.158 | 3.556 ± 0.227 |
Most of the basic statistics you can see at this page can be downloaded from this CSV file
Proteome-pI is available under Creative Commons Attribution-NoDerivs license, for more details see here
| Reference: Kozlowski LP. Proteome-pI 2.0: Proteome Isoelectric Point Database Update. Nucleic Acids Res. 2021, doi: 10.1093/nar/gkab944 | Contact: Lukasz P. Kozlowski |
