Deinococcus geothermalis (strain DSM 11300 / AG-3a)
Taxonomy: cellular organisms; Bacteria; Terrabacteria group; Deinococcus-Thermus; Deinococci; Deinococcales; Deinococcaceae; Deinococcus; Deinococcus geothermalis
Average proteome isoelectric point is 6.93
Get precalculated fractions of proteins

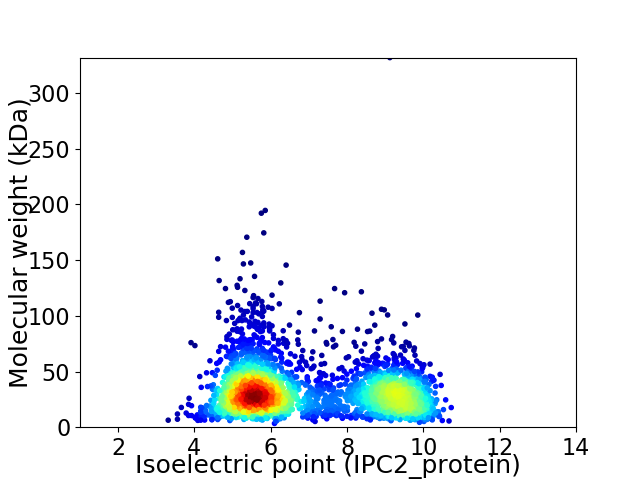
Virtual 2D-PAGE plot for 3006 proteins (isoelectric point calculated using IPC2_protein)
Get csv file with sequences according to given criteria:
* You can choose from 21 different methods for calculating isoelectric point
Summary statistics related to proteome-wise predictions


Protein with the lowest isoelectric point:
>tr|Q1J3V1|Q1J3V1_DEIGD Acyl-CoA dehydrogenase-like protein OS=Deinococcus geothermalis (strain DSM 11300 / AG-3a) OX=319795 GN=Dgeo_2399 PE=3 SV=1
MM1 pKa = 7.61TYY3 pKa = 10.72APSLSDD9 pKa = 2.86IVLPIGGSTPFYY21 pKa = 11.01VRR23 pKa = 11.84VTVPSGYY30 pKa = 10.53DD31 pKa = 3.16PSSGNQEE38 pKa = 3.82TAVIQITATTNTTPSDD54 pKa = 3.51TGSTSVTDD62 pKa = 3.28VTTVLRR68 pKa = 11.84SSASITKK75 pKa = 10.14SVALCSNPTCSSASPLSQGAPVAPNDD101 pKa = 3.75LLLYY105 pKa = 9.87TITASNTGEE114 pKa = 3.93APQNSVYY121 pKa = 10.55IADD124 pKa = 4.05TLPAEE129 pKa = 4.36TLFLSANAQGNGLPLLYY146 pKa = 10.12STDD149 pKa = 4.85NGLTWNTQAPSSLPNGTLLVGVDD172 pKa = 4.26SNNDD176 pKa = 3.27GQVNTNDD183 pKa = 3.66ALAAGQSFTVQIIVRR198 pKa = 11.84VRR200 pKa = 2.95
MM1 pKa = 7.61TYY3 pKa = 10.72APSLSDD9 pKa = 2.86IVLPIGGSTPFYY21 pKa = 11.01VRR23 pKa = 11.84VTVPSGYY30 pKa = 10.53DD31 pKa = 3.16PSSGNQEE38 pKa = 3.82TAVIQITATTNTTPSDD54 pKa = 3.51TGSTSVTDD62 pKa = 3.28VTTVLRR68 pKa = 11.84SSASITKK75 pKa = 10.14SVALCSNPTCSSASPLSQGAPVAPNDD101 pKa = 3.75LLLYY105 pKa = 9.87TITASNTGEE114 pKa = 3.93APQNSVYY121 pKa = 10.55IADD124 pKa = 4.05TLPAEE129 pKa = 4.36TLFLSANAQGNGLPLLYY146 pKa = 10.12STDD149 pKa = 4.85NGLTWNTQAPSSLPNGTLLVGVDD172 pKa = 4.26SNNDD176 pKa = 3.27GQVNTNDD183 pKa = 3.66ALAAGQSFTVQIIVRR198 pKa = 11.84VRR200 pKa = 2.95
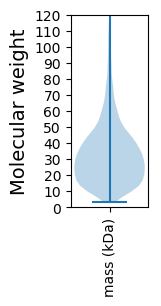
Molecular weight: 20.5 kDa
Isoelectric point according different methods:
Protein with the highest isoelectric point:
>tr|Q1IYP3|Q1IYP3_DEIGD RNA polymerase sigma 28 subunit OS=Deinococcus geothermalis (strain DSM 11300 / AG-3a) OX=319795 GN=Dgeo_1346 PE=4 SV=1
MM1 pKa = 7.24RR2 pKa = 11.84RR3 pKa = 11.84VWLFPLAATLLVACGSLASPPAPTAGDD30 pKa = 3.77LLGAPTALQLAGRR43 pKa = 11.84SLKK46 pKa = 10.67AQASPTLAGNSFNVRR61 pKa = 11.84VRR63 pKa = 11.84VQASAAPLPPLTLTGVYY80 pKa = 9.92VVTEE84 pKa = 4.36DD85 pKa = 4.64GVWTADD91 pKa = 3.3TTQSEE96 pKa = 4.68RR97 pKa = 11.84SDD99 pKa = 3.93CAPKK103 pKa = 10.69VCLQGTGRR111 pKa = 11.84GAARR115 pKa = 11.84GLRR118 pKa = 11.84PGEE121 pKa = 4.05GVQVVVSLKK130 pKa = 10.26DD131 pKa = 3.32SKK133 pKa = 11.58GRR135 pKa = 11.84MLWLRR140 pKa = 11.84VPRR143 pKa = 11.84ANIGRR148 pKa = 11.84EE149 pKa = 3.9
MM1 pKa = 7.24RR2 pKa = 11.84RR3 pKa = 11.84VWLFPLAATLLVACGSLASPPAPTAGDD30 pKa = 3.77LLGAPTALQLAGRR43 pKa = 11.84SLKK46 pKa = 10.67AQASPTLAGNSFNVRR61 pKa = 11.84VRR63 pKa = 11.84VQASAAPLPPLTLTGVYY80 pKa = 9.92VVTEE84 pKa = 4.36DD85 pKa = 4.64GVWTADD91 pKa = 3.3TTQSEE96 pKa = 4.68RR97 pKa = 11.84SDD99 pKa = 3.93CAPKK103 pKa = 10.69VCLQGTGRR111 pKa = 11.84GAARR115 pKa = 11.84GLRR118 pKa = 11.84PGEE121 pKa = 4.05GVQVVVSLKK130 pKa = 10.26DD131 pKa = 3.32SKK133 pKa = 11.58GRR135 pKa = 11.84MLWLRR140 pKa = 11.84VPRR143 pKa = 11.84ANIGRR148 pKa = 11.84EE149 pKa = 3.9
Molecular weight: 15.53 kDa
Isoelectric point according different methods:
Peptides (in silico digests for buttom-up proteomics)
Below you can find in silico digests of the whole proteome with Trypsin, Chymotrypsin, Trypsin+LysC, LysN, ArgC proteases suitable for different mass spec machines.| Try ESI |
 |
|---|
| ChTry ESI |
 |
|---|
| ArgC ESI |
 |
|---|
| LysN ESI |
 |
|---|
| TryLysC ESI |
 |
|---|
| Try MALDI |
 |
|---|
| ChTry MALDI |
 |
|---|
| ArgC MALDI |
 |
|---|
| LysN MALDI |
 |
|---|
| TryLysC MALDI |
 |
|---|
| Try LTQ |
 |
|---|
| ChTry LTQ |
 |
|---|
| ArgC LTQ |
 |
|---|
| LysN LTQ |
 |
|---|
| TryLysC LTQ |
 |
|---|
| Try MSlow |
 |
|---|
| ChTry MSlow |
 |
|---|
| ArgC MSlow |
 |
|---|
| LysN MSlow |
 |
|---|
| TryLysC MSlow |
 |
|---|
| Try MShigh |
 |
|---|
| ChTry MShigh |
 |
|---|
| ArgC MShigh |
 |
|---|
| LysN MShigh |
 |
|---|
| TryLysC MShigh |
 |
|---|
General Statistics
Number of major isoforms |
Number of additional isoforms |
Number of all proteins |
Number of amino acids |
Min. Seq. Length |
Max. Seq. Length |
Avg. Seq. Length |
Avg. Mol. Weight |
|---|---|---|---|---|---|---|---|
0 |
955421 |
30 |
3243 |
317.8 |
34.39 |
Amino acid frequency
Ala |
Cys |
Asp |
Glu |
Phe |
Gly |
His |
Ile |
Lys |
Leu |
|---|---|---|---|---|---|---|---|---|---|
12.57 ± 0.062 | 0.591 ± 0.014 |
4.817 ± 0.032 | 5.762 ± 0.046 |
3.124 ± 0.029 | 8.965 ± 0.043 |
2.154 ± 0.024 | 3.404 ± 0.036 |
2.42 ± 0.035 | 12.038 ± 0.07 |
Met |
Asn |
Gln |
Pro |
Arg |
Ser |
Thr |
Val |
Trp |
Tyr |
|---|---|---|---|---|---|---|---|---|---|
1.708 ± 0.02 | 2.432 ± 0.033 |
6.03 ± 0.035 | 3.824 ± 0.034 |
7.829 ± 0.052 | 4.679 ± 0.031 |
5.964 ± 0.043 | 7.982 ± 0.041 |
1.366 ± 0.018 | 2.34 ± 0.023 |
Most of the basic statistics you can see at this page can be downloaded from this CSV file
Proteome-pI is available under Creative Commons Attribution-NoDerivs license, for more details see here
| Reference: Kozlowski LP. Proteome-pI 2.0: Proteome Isoelectric Point Database Update. Nucleic Acids Res. 2021, doi: 10.1093/nar/gkab944 | Contact: Lukasz P. Kozlowski |
