Jembrana disease virus (JDV)
Taxonomy: Viruses; Riboviria; Pararnavirae; Artverviricota; Revtraviricetes; Ortervirales; Retroviridae; Orthoretrovirinae; Lentivirus
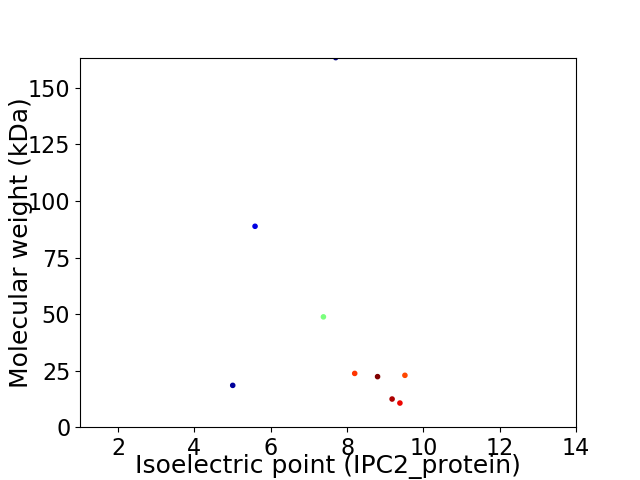
Average proteome isoelectric point is 7.73
Get precalculated fractions of proteins

Virtual 2D-PAGE plot for 9 proteins (isoelectric point calculated using IPC2_protein)
Get csv file with sequences according to given criteria:
* You can choose from 21 different methods for calculating isoelectric point
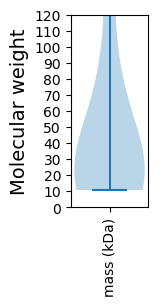
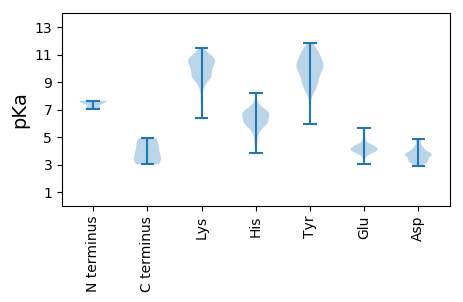
Summary statistics related to proteome-wise predictions


Protein with the lowest isoelectric point:
>sp|Q82854-2|TAT-2_JEMBR Isoform of Q82854 Isoform Short of Protein Tat OS=Jembrana disease virus OX=36370 GN=tat PE=1 SV=1
MM1 pKa = 7.62SNLGAQTRR9 pKa = 11.84YY10 pKa = 10.02QLLNAQEE17 pKa = 4.39DD18 pKa = 4.18TDD20 pKa = 4.18PAGDD24 pKa = 3.77GDD26 pKa = 3.87QPDD29 pKa = 3.78DD30 pKa = 4.17HH31 pKa = 7.54RR32 pKa = 11.84SGDD35 pKa = 3.81TPRR38 pKa = 11.84SGVPSGGWSQKK49 pKa = 10.24LSEE52 pKa = 4.29GKK54 pKa = 10.58KK55 pKa = 9.57IGCLILRR62 pKa = 11.84TEE64 pKa = 4.0WQNWRR69 pKa = 11.84NDD71 pKa = 3.0LRR73 pKa = 11.84TLRR76 pKa = 11.84WLTLGGKK83 pKa = 8.99ILQLPLSLLVLLVRR97 pKa = 11.84ILLHH101 pKa = 6.13ILSPTFQNQRR111 pKa = 11.84GWTVGRR117 pKa = 11.84KK118 pKa = 7.86GTGGDD123 pKa = 3.65DD124 pKa = 3.56RR125 pKa = 11.84EE126 pKa = 4.33LSPEE130 pKa = 4.19LEE132 pKa = 4.26YY133 pKa = 11.2LSWTGSSQEE142 pKa = 4.01MVEE145 pKa = 3.98MRR147 pKa = 11.84DD148 pKa = 3.73LKK150 pKa = 11.23EE151 pKa = 3.55EE152 pKa = 5.15DD153 pKa = 3.38IPEE156 pKa = 4.04EE157 pKa = 4.43GIRR160 pKa = 11.84PVEE163 pKa = 3.96MM164 pKa = 4.93
MM1 pKa = 7.62SNLGAQTRR9 pKa = 11.84YY10 pKa = 10.02QLLNAQEE17 pKa = 4.39DD18 pKa = 4.18TDD20 pKa = 4.18PAGDD24 pKa = 3.77GDD26 pKa = 3.87QPDD29 pKa = 3.78DD30 pKa = 4.17HH31 pKa = 7.54RR32 pKa = 11.84SGDD35 pKa = 3.81TPRR38 pKa = 11.84SGVPSGGWSQKK49 pKa = 10.24LSEE52 pKa = 4.29GKK54 pKa = 10.58KK55 pKa = 9.57IGCLILRR62 pKa = 11.84TEE64 pKa = 4.0WQNWRR69 pKa = 11.84NDD71 pKa = 3.0LRR73 pKa = 11.84TLRR76 pKa = 11.84WLTLGGKK83 pKa = 8.99ILQLPLSLLVLLVRR97 pKa = 11.84ILLHH101 pKa = 6.13ILSPTFQNQRR111 pKa = 11.84GWTVGRR117 pKa = 11.84KK118 pKa = 7.86GTGGDD123 pKa = 3.65DD124 pKa = 3.56RR125 pKa = 11.84EE126 pKa = 4.33LSPEE130 pKa = 4.19LEE132 pKa = 4.26YY133 pKa = 11.2LSWTGSSQEE142 pKa = 4.01MVEE145 pKa = 3.98MRR147 pKa = 11.84DD148 pKa = 3.73LKK150 pKa = 11.23EE151 pKa = 3.55EE152 pKa = 5.15DD153 pKa = 3.38IPEE156 pKa = 4.04EE157 pKa = 4.43GIRR160 pKa = 11.84PVEE163 pKa = 3.96MM164 pKa = 4.93
Molecular weight: 18.49 kDa
Isoelectric point according different methods:
Protein with the highest isoelectric point:
>sp|Q82855-2|REV-2_JEMBR Isoform of Q82855 Isoform Short of Protein Rev OS=Jembrana disease virus OX=36370 GN=rev PE=4 SV=1
MM1 pKa = 7.63PGPWATTLTFPGHH14 pKa = 6.14NGGFGGGPKK23 pKa = 9.97CWLFWNTCAGPRR35 pKa = 11.84RR36 pKa = 11.84VCPKK40 pKa = 9.6CSCPICVWHH49 pKa = 6.79CQLCFLQKK57 pKa = 10.9GLGIRR62 pKa = 11.84HH63 pKa = 6.72DD64 pKa = 3.68GRR66 pKa = 11.84RR67 pKa = 11.84KK68 pKa = 9.85KK69 pKa = 10.56RR70 pKa = 11.84GTRR73 pKa = 11.84GKK75 pKa = 10.3GRR77 pKa = 11.84KK78 pKa = 7.47IHH80 pKa = 5.47YY81 pKa = 8.97ARR83 pKa = 11.84SITEE87 pKa = 3.89SGGQRR92 pKa = 11.84APNCAA97 pKa = 3.33
MM1 pKa = 7.63PGPWATTLTFPGHH14 pKa = 6.14NGGFGGGPKK23 pKa = 9.97CWLFWNTCAGPRR35 pKa = 11.84RR36 pKa = 11.84VCPKK40 pKa = 9.6CSCPICVWHH49 pKa = 6.79CQLCFLQKK57 pKa = 10.9GLGIRR62 pKa = 11.84HH63 pKa = 6.72DD64 pKa = 3.68GRR66 pKa = 11.84RR67 pKa = 11.84KK68 pKa = 9.85KK69 pKa = 10.56RR70 pKa = 11.84GTRR73 pKa = 11.84GKK75 pKa = 10.3GRR77 pKa = 11.84KK78 pKa = 7.47IHH80 pKa = 5.47YY81 pKa = 8.97ARR83 pKa = 11.84SITEE87 pKa = 3.89SGGQRR92 pKa = 11.84APNCAA97 pKa = 3.33
Molecular weight: 10.68 kDa
Isoelectric point according different methods:
Peptides (in silico digests for buttom-up proteomics)
Below you can find in silico digests of the whole proteome with Trypsin, Chymotrypsin, Trypsin+LysC, LysN, ArgC proteases suitable for different mass spec machines.| Try ESI |
 |
|---|
| ChTry ESI |
 |
|---|
| ArgC ESI |
 |
|---|
| LysN ESI |
 |
|---|
| TryLysC ESI |
 |
|---|
| Try MALDI |
 |
|---|
| ChTry MALDI |
 |
|---|
| ArgC MALDI |
 |
|---|
| LysN MALDI |
 |
|---|
| TryLysC MALDI |
 |
|---|
| Try LTQ |
 |
|---|
| ChTry LTQ |
 |
|---|
| ArgC LTQ |
 |
|---|
| LysN LTQ |
 |
|---|
| TryLysC LTQ |
 |
|---|
| Try MSlow |
 |
|---|
| ChTry MSlow |
 |
|---|
| ArgC MSlow |
 |
|---|
| LysN MSlow |
 |
|---|
| TryLysC MSlow |
 |
|---|
| Try MShigh |
 |
|---|
| ChTry MShigh |
 |
|---|
| ArgC MShigh |
 |
|---|
| LysN MShigh |
 |
|---|
| TryLysC MShigh |
 |
|---|
General Statistics
Number of major isoforms |
Number of additional isoforms |
Number of all proteins |
Number of amino acids |
Min. Seq. Length |
Max. Seq. Length |
Avg. Seq. Length |
Avg. Mol. Weight |
|---|---|---|---|---|---|---|---|
3635 |
97 |
1432 |
403.9 |
45.75 |
Amino acid frequency
Ala |
Cys |
Asp |
Glu |
Phe |
Gly |
His |
Ile |
Lys |
Leu |
|---|---|---|---|---|---|---|---|---|---|
6.025 ± 0.678 | 2.476 ± 0.626 |
4.539 ± 0.353 | 7.455 ± 0.749 |
2.503 ± 0.307 | 8.171 ± 1.144 |
2.669 ± 0.25 | 5.475 ± 0.805 |
6.162 ± 0.915 | 9.106 ± 0.748 |
Met |
Asn |
Gln |
Pro |
Arg |
Ser |
Thr |
Val |
Trp |
Tyr |
|---|---|---|---|---|---|---|---|---|---|
1.871 ± 0.178 | 3.659 ± 0.36 |
6.052 ± 0.499 | 4.677 ± 0.412 |
7.345 ± 1.004 | 5.117 ± 0.754 |
5.695 ± 0.442 | 5.695 ± 0.863 |
2.806 ± 0.345 | 2.503 ± 0.376 |
Most of the basic statistics you can see at this page can be downloaded from this CSV file
Proteome-pI is available under Creative Commons Attribution-NoDerivs license, for more details see here
| Reference: Kozlowski LP. Proteome-pI 2.0: Proteome Isoelectric Point Database Update. Nucleic Acids Res. 2021, doi: 10.1093/nar/gkab944 | Contact: Lukasz P. Kozlowski |
